Fairfield: Fire Incidents, Illinois (IL)
Where are fire incidents reported in Fairfield, IL
Something went wrong! Please refresh the page.
|
| |||||||||||||||||||||||||||||||||||||||||||||||||||||||||||||||||||||||||||||||||||||||||||||||||||||||||||||
| Other | 193 | |||||||||||||||||||||||||||||||||||||||||||||||||||||||||||||||||||||||||||||||||||||||||||||||||||||||||||||
2002 - 2018 National Fire Incident Reporting System (NFIRS) incidents
- Incident types reported to NFIRS in Fairfield, IL
- 2,18560.2%Rescue & EMS
- 83723.1%Fire
- 1875.2%Hazardous Condition
- 1845.1%Good Intent Call
- 1393.8%False Alarm
- 852.3%Service Call
- 60.2%Special Incident
- 40.1%Overpressure Rupture
- Fire incident types reported to NFIRS in Fairfield, IL
- 36243.2%Outside Fires
- 29234.9%Structure Fires
- 16519.7%Mobile Property/Vehicle Fires
- 182.2%Other
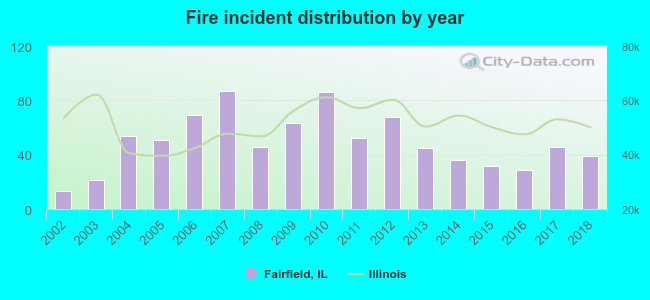 According to the data from the years 2002 - 2018 the average number of fire incidents per year is 49. The highest number of fires - 87 took place in 2007, and the least - 13 in 2002. The data has a rising trend.
The average number of yearly fire incidents per 10k residents in Fairfield, IL compared to nearest cities:
(Note: Based on data for the last 3 years, including only cities with population 5,000 and above)
| Fairfield: | 74.8 |
| Carmi: | 87.0 |
| Olney: | 58.3 |
| Mount Vernon: | 16.0 |
| Mount Carmel: | 16.6 |
| Salem: | 98.6 |
| Benton: | 150.6 |
 The median response time based on all reported fire incidents is 6 minutes. This is about the same as the state median value.
The median response time in Fairfield, IL compared to nearest cities:
(Note: Based on data for all years, including only cities with at least 500 fire incidents)
| Fairfield: | 6 minutes |
| Olney: | 5 minutes |
| Mount Vernon: | 4 minutes |
| Salem: | 7 minutes |
| Benton: | 4 minutes |
 26.8% incidents where reported in the morning and 73.2% in the evening. The most fires (18.0%) took place on Monday, and the least (11.2%) on Tuesday.
 Based on the 837 incident reports from years 2002 - 2018 most fires (14.5%) took place during March, and the least (5.5%) in May.
 Out of all 3,629 cases reported during the years 2002 - 2018, the most belonged to the categories: Rescue & EMS (60.2%), Fire (23.1%), and Hazardous Condition (5.2%).
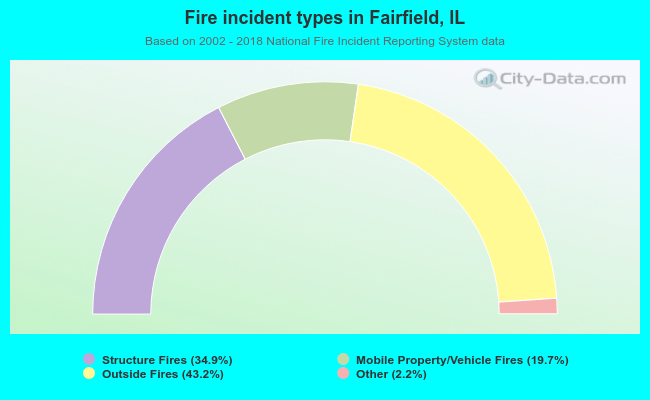 When looking into fire subcategories, the most incidents belonged to: Outside Fires (43.2%), and Structure Fires (34.9%).