Carmi: Fire Incidents, Illinois (IL)
Where are fire incidents reported in Carmi, IL
Something went wrong! Please refresh the page.
|
| |||||||||||||||||||||||||||||||||||||||||||||||||||||||||||||||||||||||||||||||||||||||||||||||||||||||||||||
| Other | 124 | |||||||||||||||||||||||||||||||||||||||||||||||||||||||||||||||||||||||||||||||||||||||||||||||||||||||||||||
2007 - 2018 National Fire Incident Reporting System (NFIRS) incidents
- Incident types reported to NFIRS in Carmi, IL
- 42069.4%Fire
- 467.6%Service Call
- 447.3%Good Intent Call
- 437.1%Hazardous Condition
- 416.8%False Alarm
- 71.2%Special Incident
- 20.3%Overpressure Rupture
- 10.2%Rescue & EMS
- 10.2%Severe Weather
- Fire incident types reported to NFIRS in Carmi, IL
- 16439.0%Structure Fires
- 13632.4%Outside Fires
- 6415.2%Mobile Property/Vehicle Fires
- 5613.3%Other
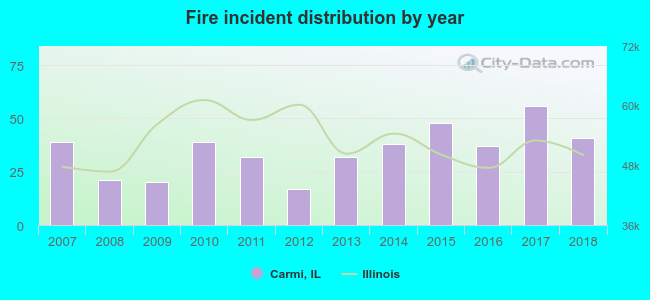 Based on the data from the years 2007 - 2018 the average number of fires per year is 35. The highest number of fire incidents - 56 took place in 2017, and the least - 17 in 2012. The data has a rising trend.
The average number of yearly fire incidents per 10k residents in Carmi, IL compared to nearest cities:
(Note: Based on data for the last 3 years, including only cities with population 5,000 and above)
| Carmi: | 87.0 |
| Fairfield: | 74.8 |
| Mount Carmel: | 16.6 |
| Harrisburg: | 71.4 |
| Benton: | 150.6 |

 33.6% incidents where reported in the morning and 66.4% in the evening. The most fires (20.0%) took place on Saturday, and the least (10.0%) on Sunday.
 Based on the 420 reports from years 2007 - 2018 most fires (12.1%) took place during April, and the least (5.5%) in May.
 Out of all 605 cases reported during the years 2007 - 2018, the most belonged to the categories: Fire (69.4%), Service Call (7.6%), and Good Intent Call (7.3%).
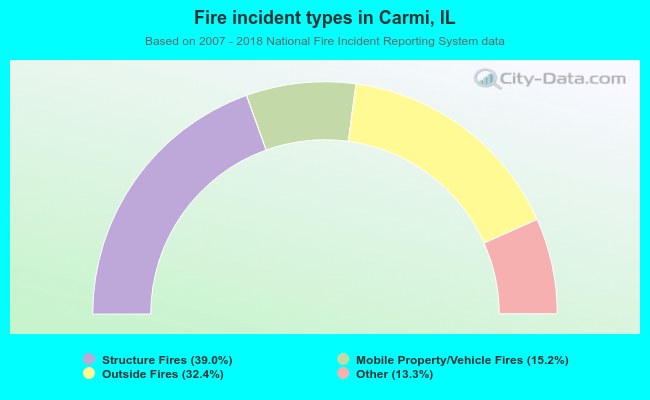 When looking into fire subcategories, the most incidents belonged to: Structure Fires (39.0%), and Outside Fires (32.4%).