Pinckneyville: Fire Incidents, Illinois (IL)
Where are fire incidents reported in Pinckneyville, IL
Something went wrong! Please refresh the page.
|
| |||||||||||||||||||||||||||||||||||||||||||||||||||||||||||||||||||||||||||||||||||||||||||||||||||||||||||||
| Other | 8 | |||||||||||||||||||||||||||||||||||||||||||||||||||||||||||||||||||||||||||||||||||||||||||||||||||||||||||||
2006 - 2018 National Fire Incident Reporting System (NFIRS) incidents
- Incident types reported to NFIRS in Pinckneyville, IL
- 38056.3%Fire
- 9814.5%Hazardous Condition
- 9213.6%Rescue & EMS
- 385.6%Service Call
- 334.9%False Alarm
- 233.4%Good Intent Call
- 91.3%Severe Weather
- 20.3%Overpressure Rupture
- Fire incident types reported to NFIRS in Pinckneyville, IL
- 17746.6%Structure Fires
- 14738.7%Outside Fires
- 5313.9%Mobile Property/Vehicle Fires
- 30.8%Other
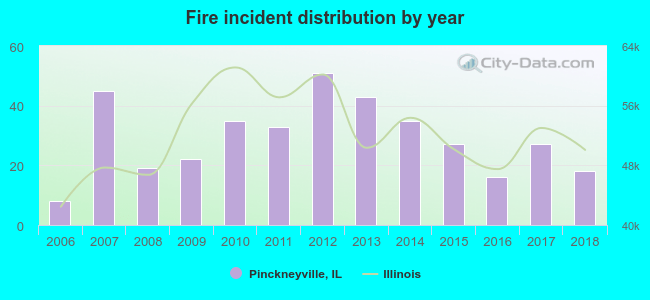 According to the data from the years 2006 - 2018 the average number of fires per year is 29. The highest number of fires - 51 took place in 2012, and the least - 8 in 2006. The data has an increasing trend.
The average number of yearly fire incidents per 10k residents in Pinckneyville, IL compared to nearest cities:
(Note: Based on data for the last 3 years, including only cities with population 5,000 and above)
| Pinckneyville: | 36.7 |
| Du Quoin: | 63.8 |
| Murphysboro: | 108.4 |
| Carbondale: | 52.3 |
| Benton: | 150.6 |
| Chester: | 35.2 |
| Herrin: | 51.6 |
| Carterville: | 69.3 |
| West Frankfort: | 153.5 |

 Based on the data from the years 2006 - 2018 the average number of fire-related casualties per year is 0. The highest number of casualties - 2 took place in 2010, and the lowest - 0 in 2006. The data has a constant trend.
 31.8% incidents where reported in the morning and 68.2% in the evening. The most fires (16.3%) took place on Wednesday, and the least (10.5%) on Thursday.
 Based on the 380 incident reports from years 2006 - 2018 most fires (12.6%) took place during March, and the least (3.4%) in May.
 Out of all 675 cases reported during the years 2006 - 2018, the most belonged to the categories: Fire (56.3%), Hazardous Condition (14.5%), and Rescue & EMS (13.6%).
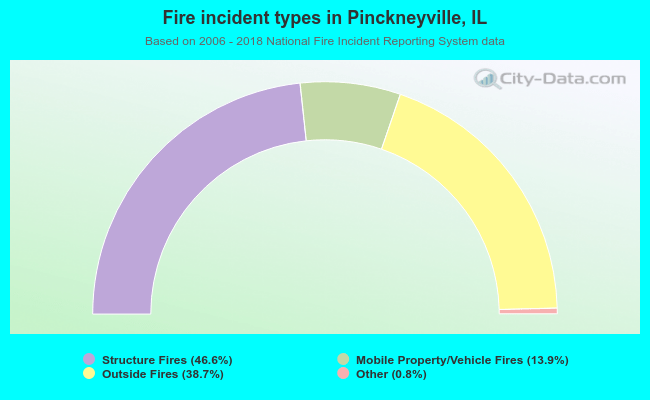 When looking into fire subcategories, the most reports belonged to: Structure Fires (46.6%), and Outside Fires (38.7%).