Carterville: Fire Incidents, Illinois (IL)
Where are fire incidents reported in Carterville, IL
Something went wrong! Please refresh the page.
|
| |||||||||||||||||||||||||||||||||||||||||||||||||||||||||||||||||||||||||||||||||||||||||||||||||||||||||||||
| Other | 70 | |||||||||||||||||||||||||||||||||||||||||||||||||||||||||||||||||||||||||||||||||||||||||||||||||||||||||||||
2002 - 2018 National Fire Incident Reporting System (NFIRS) incidents
- Incident types reported to NFIRS in Carterville, IL
- 55845.1%Fire
- 25220.4%Hazardous Condition
- 15212.3%False Alarm
- 14111.4%Rescue & EMS
- 776.2%Good Intent Call
- 514.1%Service Call
- 30.2%Overpressure Rupture
- Fire incident types reported to NFIRS in Carterville, IL
- 26848.0%Outside Fires
- 20837.3%Structure Fires
- 6211.1%Mobile Property/Vehicle Fires
- 203.6%Other
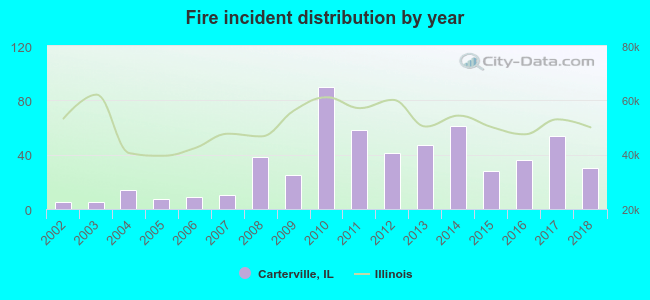 According to the data from the years 2002 - 2018 the average number of fires per year is 33. The highest number of reported fires - 90 took place in 2010, and the least - 5 in 2002. The data has a growing trend.
The average number of yearly fire incidents per 10k residents in Carterville, IL compared to nearest cities:
(Note: Based on data for the last 3 years, including only cities with population 5,000 and above)
| Carterville: | 69.3 |
| Herrin: | 51.6 |
| Carbondale: | 52.3 |
| Marion: | 107.8 |
| West Frankfort: | 153.5 |
| Murphysboro: | 108.4 |
| Du Quoin: | 63.8 |
| Benton: | 150.6 |
| Pinckneyville: | 36.7 |
 The median response time based on all reported fire incidents is 6 minutes. This is close to the Illinois median value.
The median response time in Carterville, IL compared to nearest cities:
(Note: Based on data for all years, including only cities with at least 500 fire incidents)
| Carterville: | 6 minutes |
| Herrin: | 4 minutes |
| Carbondale: | 4 minutes |
| Marion: | 5 minutes |
| Johnston City: | 6 minutes |
| Mitchell: | 5 minutes |
| West Frankfort: | 5 minutes |
| Murphysboro: | 5 minutes |
| Benton: | 4 minutes |
 26.9% incidents where reported in the morning and 73.1% in the evening. The most fires (17.9%) took place on Monday, and the least (11.3%) on Tuesday.
 Based on the 558 incident reports from years 2002 - 2018 most fires (11.6%) took place during March, and the least (5.2%) in July.
 Out of all 1,236 cases reported during the years 2002 - 2018, the most belonged to the categories: Fire (45.1%), Hazardous Condition (20.4%), and False Alarm (12.3%).
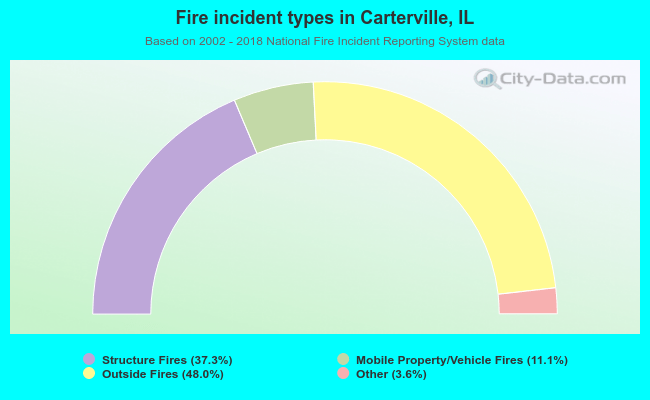 When looking into fire subcategories, the most incidents belonged to: Outside Fires (48.0%), and Structure Fires (37.3%).