Mooresville: Fire Incidents, North Carolina (NC)
Where are fire incidents reported in Mooresville, NC
Something went wrong! Please refresh the page.
| Fire incidents reported | |
|---|---|
| Sreet name | Count |
| CHARLOTTE HWY | 182 |
| RIVER HWY | 172 |
| BRAWLEY SCHOOL RD | 156 |
| MAIN ST | 114 |
| PLAZA DR | 112 |
| WILLIAMSON RD | 90 |
| SHEARERS RD | 84 |
| I-77 | 76 |
| SHINNVILLE RD | 72 |
| CODDLE CREEK HWY | 66 |
| I-77 FWY | 62 |
| DEAL RD | 56 |
| FAITH RD | 52 |
| I77 | 52 |
| I77 HWY | 50 |
| CORNELIUS RD | 48 |
| MECKLENBURG HWY | 46 |
| WILSON AVE | 44 |
| MAZEPPA RD | 42 |
| NORMAN STATION BLVD | 40 |
| OAK RIDGE FARM HWY | 40 |
| MACKWOOD RD | 36 |
| BROAD ST | 34 |
| ROBINSON RD | 34 |
| CHURCH ST | 32 |
| GREENBAY RD | 32 |
| KEMP RD | 32 |
| OAKRIDGE FARM HWY | 32 |
| WIGGINS RD | 32 |
| ACADEMY ST | 30 |
| Other | 2,079 |
2002 - 2018 National Fire Incident Reporting System (NFIRS) incidents
- Incident types reported to NFIRS in Mooresville, NC
- 19,77248.4%Rescue & EMS
- 5,17612.7%Good Intent Call
- 4,27510.5%Service Call
- 4,0299.9%Fire
- 3,8119.3%Hazardous Condition
- 3,3558.2%False Alarm
- 2500.6%Severe Weather
- 1030.3%Special Incident
- 820.2%Overpressure Rupture
- Fire incident types reported to NFIRS in Mooresville, NC
- 1,76843.9%Structure Fires
- 1,57839.2%Outside Fires
- 53313.2%Mobile Property/Vehicle Fires
- 1503.7%Other
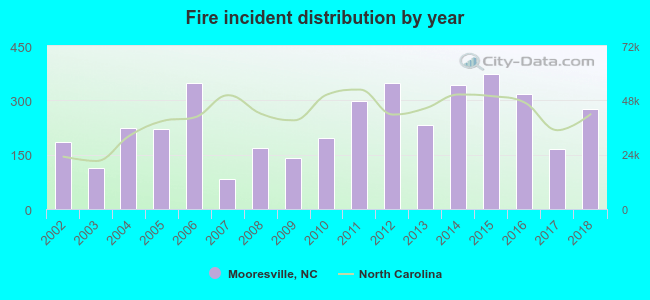 Based on the data from the years 2002 - 2018 the average number of fires per year is 237. The highest number of reported fire incidents - 373 took place in 2015, and the least - 84 in 2007. The data has a rising trend.
The average number of yearly fire incidents per 10k residents in Mooresville, NC compared to nearest cities:
(Note: Based on data for the last 3 years, including only cities with population 5,000 and above)
| Mooresville: | 71.8 |
| Davidson: | 19.2 |
| Cornelius: | 14.8 |
| Huntersville: | 7.4 |
| Kannapolis: | 24.5 |
| Statesville: | 105.5 |
| Concord: | 31.7 |
| Salisbury: | 116.0 |
| Harrisburg: | 21.2 |
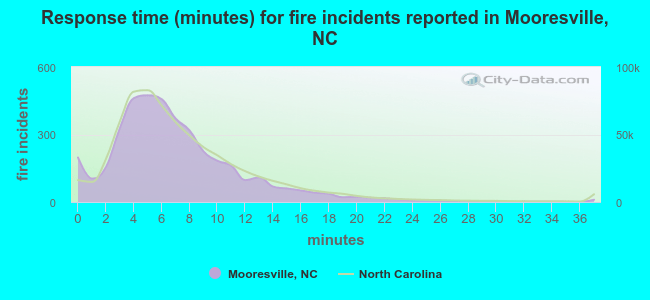 The median response time based on all reported fire incidents is 6 minutes. This is about the same as the North Carolina median value.
The median response time in Mooresville, NC compared to nearest cities:
(Note: Based on data for all years, including only cities with at least 500 fire incidents)
| Mooresville: | 6 minutes |
| Davidson: | 7 minutes |
| Cornelius: | 5 minutes |
| Troutman: | 7 minutes |
| Sherrills Ford: | 5 minutes |
| Huntersville: | 6 minutes |
| Denver: | 6 minutes |
| Kannapolis: | 5 minutes |
| China Grove: | 8 minutes |
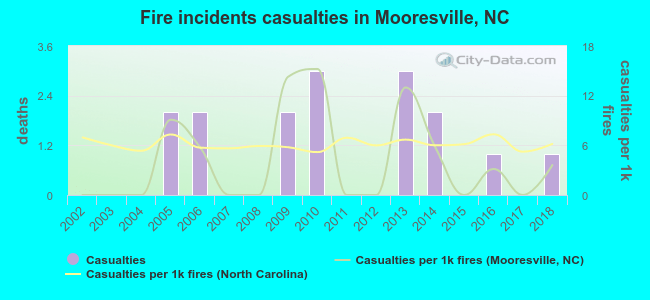 According to the reports from the years 2002 - 2018 the average number of fire-related yearly casualties is 1. The highest number of casualties - 3 took place in 2010, and the lowest - 0 in 2002. The data has a growing trend.
The average number of casualties per 1,000 fires is 4. This indicator was the highest - 15 in 2010, and the lowest 0 in 2002. The trend for casualties per 1,000 fires is growing. Compared to the North Carolina value the number of casualties per 1,000 incidents is lower.
According to the reports from the years 2002 - 2018 the average number of fire-related yearly casualties is 1. The highest number of casualties - 3 took place in 2010, and the lowest - 0 in 2002. The data has a growing trend.
The average number of casualties per 1,000 fires is 4. This indicator was the highest - 15 in 2010, and the lowest 0 in 2002. The trend for casualties per 1,000 fires is growing. Compared to the North Carolina value the number of casualties per 1,000 incidents is lower.Casualties per 1,000 incidents in Mooresville, NC compared to nearest cities:
(Note: Based on data for all years, including only cities with at least 500 fire incidents)
| Mooresville: | 4.0 |
| Davidson: | 3.3 |
| Cornelius: | 1.2 |
| Troutman: | 0.0 |
| Sherrills Ford: | 0.0 |
| Huntersville: | 1.7 |
| Denver: | 2.7 |
| Kannapolis: | 19.0 |
| China Grove: | 0.0 |
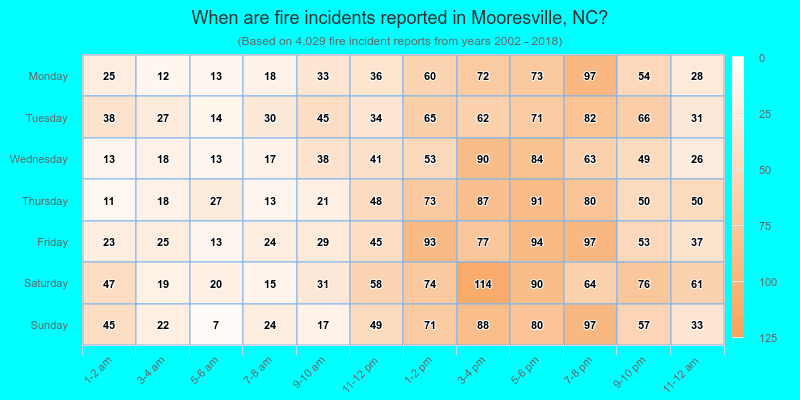
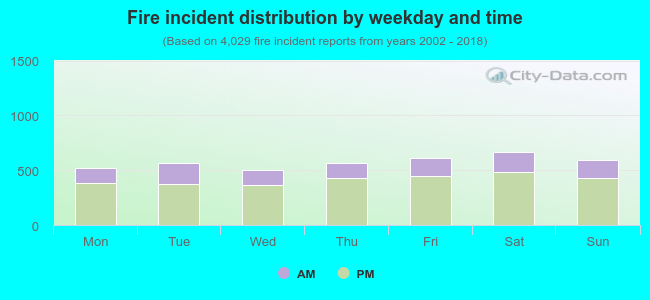 27.7% incidents where reported in the morning and 72.3% in the evening. The most fires (16.6%) took place on Saturday, and the least (12.5%) on Wednesday.
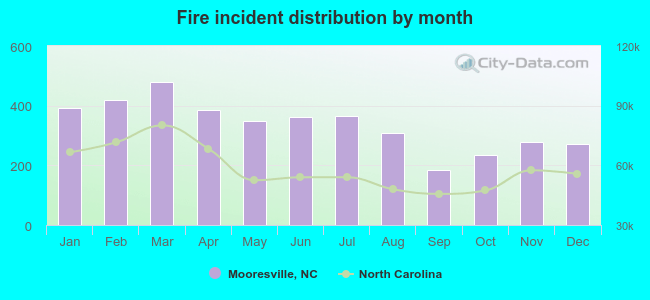 Based on the 4,029 incident reports from years 2002 - 2018 most fires (11.9%) took place during March, and the least (4.6%) in September.
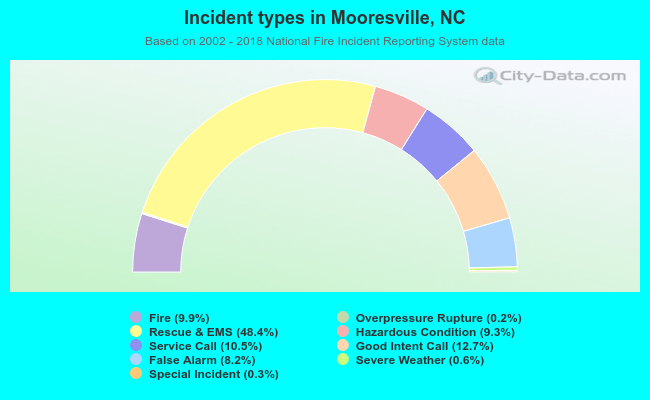 Out of all 40,853 cases reported during the years 2002 - 2018, the most belonged to the categories: Rescue & EMS (48.4%), Good Intent Call (12.7%), and Service Call (10.5%).
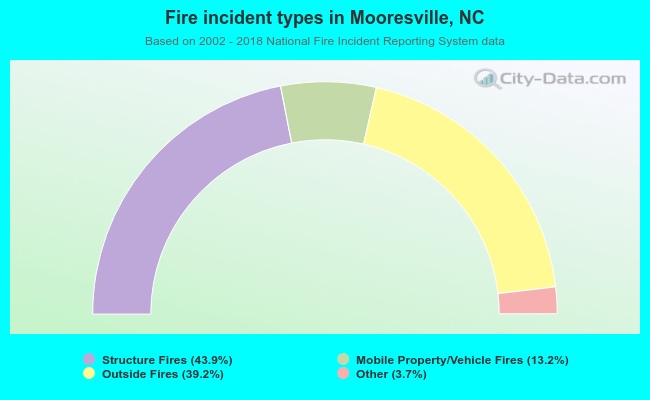 When looking into fire subcategories, the most incidents belonged to: Structure Fires (43.9%), and Outside Fires (39.2%).