Denver: Fire Incidents, North Carolina (NC)
Where are fire incidents reported in Denver, NC
Something went wrong! Please refresh the page.
|
| |||||||||||||||||||||||||||||||||||||||||||||||||||||||||||||||||||||||||||||||||||||||||||||||||||||||||||||
| Other | 168 | |||||||||||||||||||||||||||||||||||||||||||||||||||||||||||||||||||||||||||||||||||||||||||||||||||||||||||||
2002 - 2018 National Fire Incident Reporting System (NFIRS) incidents
- Incident types reported to NFIRS in Denver, NC
- 3,88446.5%Rescue & EMS
- 1,12413.5%Fire
- 1,09813.1%Good Intent Call
- 7509.0%False Alarm
- 7378.8%Service Call
- 6858.2%Hazardous Condition
- 370.4%Severe Weather
- 220.3%Overpressure Rupture
- 180.2%Special Incident
- Fire incident types reported to NFIRS in Denver, NC
- 50845.2%Structure Fires
- 40035.6%Outside Fires
- 13712.2%Mobile Property/Vehicle Fires
- 797.0%Other
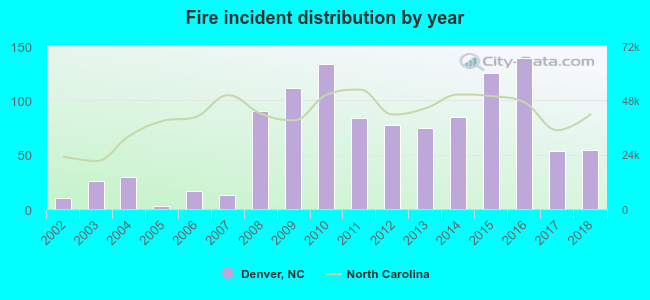 Based on the data from the years 2002 - 2018 the average number of fires per year is 66. The highest number of fires - 139 took place in 2016, and the least - 3 in 2005. The data has an increasing trend.
 The median response time based on all reported fire incidents is 6 minutes. This is close to the North Carolina median value.
The median response time in Denver, NC compared to nearest cities:
(Note: Based on data for all years, including only cities with at least 500 fire incidents)
| Denver: | 6 minutes |
| Sherrills Ford: | 5 minutes |
| Cornelius: | 5 minutes |
| Maiden: | 6 minutes |
| Davidson: | 7 minutes |
| Mooresville: | 6 minutes |
| Stanley: | 8 minutes |
| Huntersville: | 6 minutes |
| Lincolnton: | 6 minutes |
 According to the data from the years 2002 - 2018 the average number of fire-related yearly deaths is 0. The highest number of reported deaths - 1 took place in 2008, and the lowest - 0 in 2002. The data has a constant trend.
 26.8% incidents where reported in the morning and 73.2% in the evening. The most fires (16.5%) took place on Saturday, and the least (12.6%) on Monday.
 Based on the 1,124 fires from years 2002 - 2018 most fires (13.5%) took place during February, and the least (4.7%) in August.
 Out of all 8,355 cases reported during the years 2002 - 2018, the most belonged to the categories: Rescue & EMS (46.5%), Fire (13.5%), and Good Intent Call (13.1%).
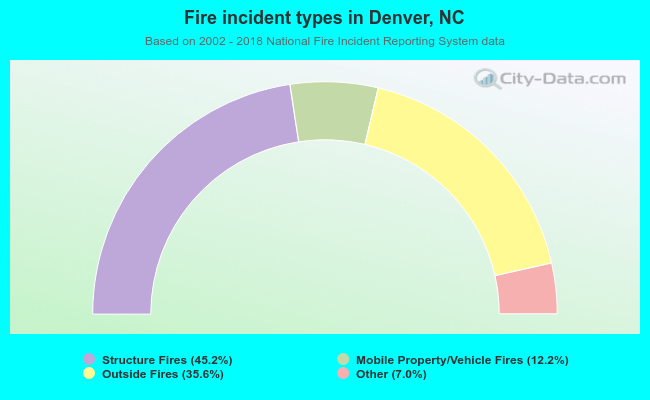 When looking into fire subcategories, the most incidents belonged to: Structure Fires (45.2%), and Outside Fires (35.6%).