Huntersville: Fire Incidents, North Carolina (NC)
Where are fire incidents reported in Huntersville, NC
Something went wrong! Please refresh the page.
| Fire incidents reported | |
|---|---|
| Sreet name | Count |
| STATESVILLE RD | 126 |
| OLD STATESVILLE RD | 98 |
| BEATTIES FORD RD | 92 |
| SAM FURR RD | 62 |
| HAMBRIGHT RD | 60 |
| GILEAD RD | 58 |
| INTERSTATE I-77 NORTH HIGHWAY | 40 |
| INTERSTATE I-77 SOUTH HIGHWAY | 36 |
| OLD STATESVILLE | 34 |
| BIRKDALE COMMONS PKY | 32 |
| ASBURY CHAPEL RD | 28 |
| STUMPTOWN RD | 28 |
| INTERSTATE 77 HWY | 26 |
| INTERSTATE I77 NORTH HWY | 26 |
| MCCOY RD | 26 |
| STATESVILLE | 24 |
| EASTFIELD RD | 22 |
| KERNS RD | 22 |
| POPLAR TENT RD | 22 |
| RAMAH CHURCH RD | 22 |
| INTERSTATE I-77 SOUTH HWY | 20 |
| LACROSSE DR | 20 |
| ANGEL OAK DR | 18 |
| HUNTERS RD | 18 |
| I77 | 18 |
| HAMBRIGHT | 16 |
| HUNTERSVILLE - CONCORD RD | 16 |
| I77 HWY | 16 |
| MCCORD RD | 16 |
| MCILLWAINE RD | 16 |
| Other | 760 |
2005 - 2018 National Fire Incident Reporting System (NFIRS) incidents
- Incident types reported to NFIRS in Huntersville, NC
- 3,75834.5%Rescue & EMS
- 1,90417.5%Good Intent Call
- 1,81816.7%Fire
- 1,67015.3%Hazardous Condition
- 1,12310.3%False Alarm
- 5505.1%Service Call
- 330.3%Severe Weather
- 200.2%Special Incident
- 130.1%Overpressure Rupture
- Fire incident types reported to NFIRS in Huntersville, NC
- 80144.1%Structure Fires
- 69238.1%Outside Fires
- 26714.7%Mobile Property/Vehicle Fires
- 583.2%Other
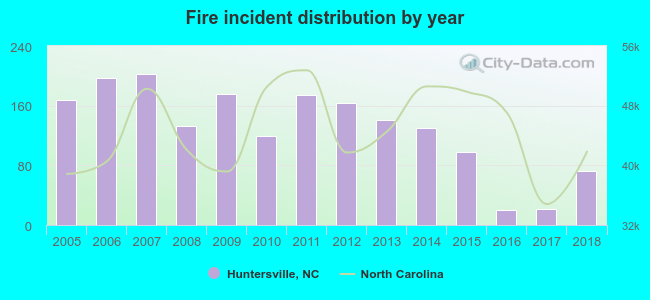 According to the data from the years 2005 - 2018 the average number of fires per year is 130. The highest number of reported fire incidents - 202 took place in 2007, and the least - 20 in 2016. The data has a dropping trend.
The average number of yearly fire incidents per 10k residents in Huntersville, NC compared to nearest cities:
(Note: Based on data for the last 3 years, including only cities with population 5,000 and above)
| Huntersville: | 7.4 |
| Cornelius: | 14.8 |
| Davidson: | 19.2 |
| Mount Holly: | 58.7 |
| Mooresville: | 71.8 |
| Harrisburg: | 21.2 |
| Charlotte: | 21.2 |
| Concord: | 31.7 |
| Kannapolis: | 24.5 |
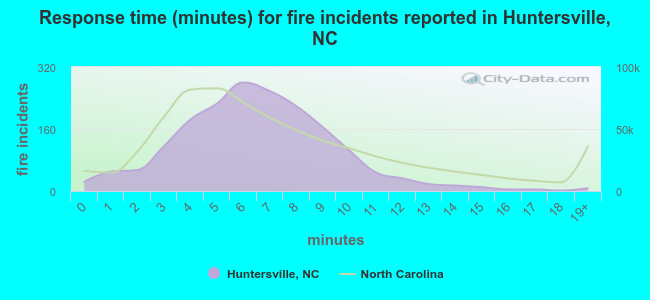 The median response time based on all reported fire incidents is 6 minutes. This is comparable to the North Carolina median value.
The median response time in Huntersville, NC compared to nearest cities:
(Note: Based on data for all years, including only cities with at least 500 fire incidents)
| Huntersville: | 6 minutes |
| Cornelius: | 5 minutes |
| Davidson: | 7 minutes |
| Mount Holly: | 7 minutes |
| Mooresville: | 6 minutes |
| Denver: | 6 minutes |
| Stanley: | 8 minutes |
| Charlotte: | 5 minutes |
| Concord: | 5 minutes |
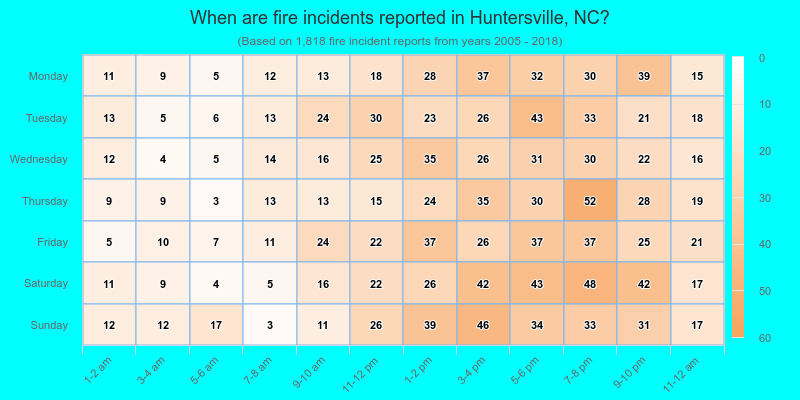
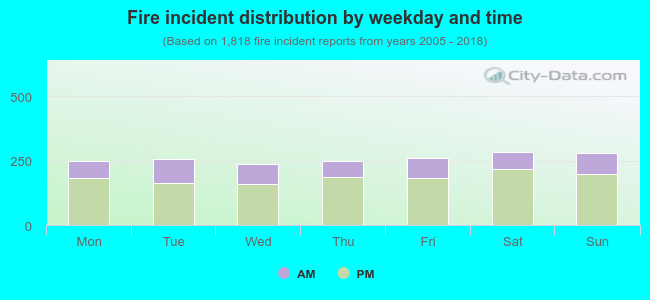 28.8% incidents where reported in the morning and 71.2% in the evening. The most fires (15.7%) took place on Saturday, and the least (13.0%) on Wednesday.
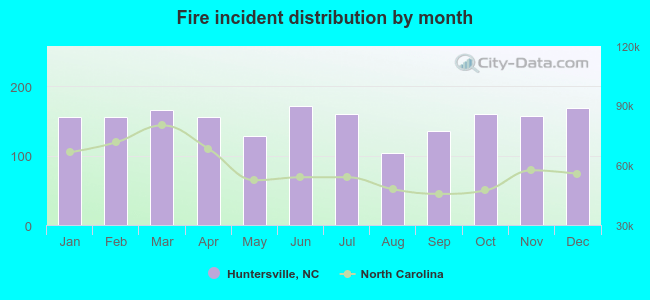 According to the 1,818 fire incident reports from years 2005 - 2018 most fires (9.5%) took place during June, and the least (5.7%) in August.
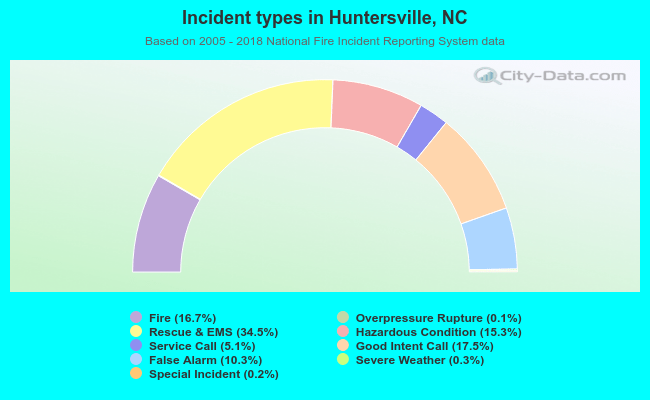 Out of all 10,889 cases reported during the years 2005 - 2018, the most belonged to the categories: Rescue & EMS (34.5%), Good Intent Call (17.5%), and Fire (16.7%).
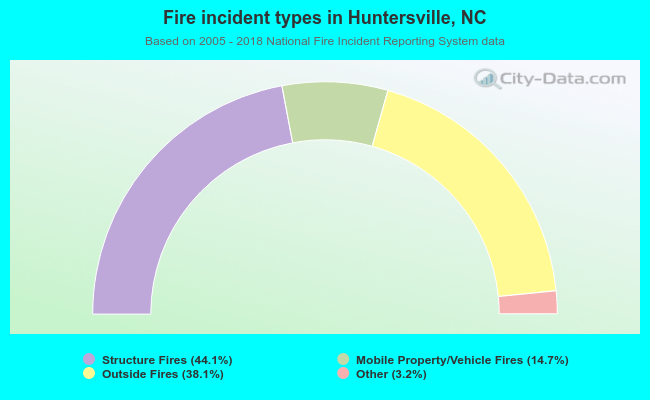 When looking into fire subcategories, the most reports belonged to: Structure Fires (44.1%), and Outside Fires (38.1%).