Middletown: Fire Incidents, Ohio (OH)
Where are fire incidents reported in Middletown, OH
Something went wrong! Please refresh the page.
| Fire incidents reported | |
|---|---|
| Sreet name | Count |
| OXFORD STATE RD | 190 |
| MAIN ST | 186 |
| YANKEE RD | 96 |
| CENTRAL AVE | 84 |
| BREIEL BLVD | 70 |
| ROOSEVELT BLVD | 68 |
| COLUMBIA AVE | 64 |
| BALTIMORE ST | 58 |
| GARFIELD ST | 58 |
| HAMILTON-MIDDLETOWN RD | 58 |
| TYTUS AVE | 58 |
| AK STEEL | 56 |
| WOODLAWN AVE | 56 |
| VERITY PKWY | 54 |
| LEFFERSON RD | 52 |
| VERITY PKWY | 52 |
| CINCINNATI-DAYTON RD | 50 |
| WILBRAHAM RD | 48 |
| TOWNE BLVD | 46 |
| GRAND AVE | 44 |
| UNIVERSITY BLVD | 44 |
| BONITA DR | 40 |
| CHARLES ST | 40 |
| LAFAYETTE AVE | 40 |
| QUEEN AVE | 40 |
| CLARK ST | 38 |
| HIGHLAND ST | 38 |
| SUTPHIN ST | 36 |
| AUBURN ST | 32 |
| BAVARIAN ST | 32 |
| Other | 987 |
2002 - 2018 National Fire Incident Reporting System (NFIRS) incidents
- Incident types reported to NFIRS in Middletown, OH
- 4,24726.6%Service Call
- 2,81517.7%Fire
- 2,77017.4%Rescue & EMS
- 2,49015.6%Hazardous Condition
- 1,81111.4%False Alarm
- 1,76211.0%Good Intent Call
- 240.2%Overpressure Rupture
- 200.1%Severe Weather
- Fire incident types reported to NFIRS in Middletown, OH
- 1,47352.3%Structure Fires
- 81629.0%Outside Fires
- 51718.4%Mobile Property/Vehicle Fires
- 90.3%Other
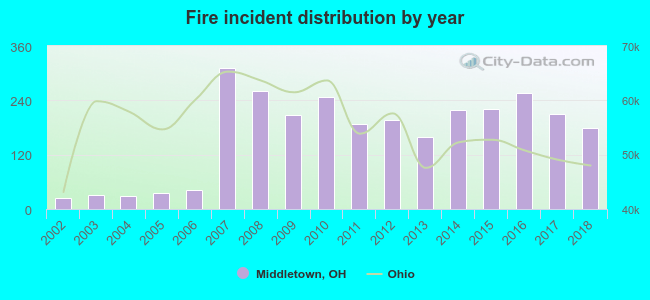 Based on the data from the years 2002 - 2018 the average number of fires per year is 166. The highest number of fire incidents - 312 took place in 2007, and the least - 25 in 2002. The data has an increasing trend.
The average number of yearly fire incidents per 10k residents in Middletown, OH compared to nearest cities:
(Note: Based on data for the last 3 years, including only cities with population 5,000 and above)
| Middletown: | 44.0 |
| Monroe: | 33.4 |
| Trenton: | 34.0 |
| Franklin: | 54.2 |
| Carlisle: | 41.7 |
| Germantown: | 65.4 |
| Springboro: | 20.9 |
| Lebanon: | 29.0 |
| Miamisburg: | 56.7 |
 The median response time based on all reported fire incidents is 5 minutes. This is lower compared to the state median value.
The median response time in Middletown, OH compared to nearest cities:
(Note: Based on data for all years, including only cities with at least 500 fire incidents)
| Middletown: | 5 minutes |
| Monroe: | 5 minutes |
| Trenton: | 6 minutes |
| Franklin: | 5 minutes |
| Carlisle: | 6 minutes |
| Germantown: | 7 minutes |
| Springboro: | 6 minutes |
| Miamisburg: | 6 minutes |
| Mason: | 5 minutes |
 According to the reports from the years 2002 - 2018 the average number of fire-related yearly deaths is 0. The highest number of deaths - 2 took place in 2014, and the lowest - 0 in 2002. The data has a constant trend.
The average number of deaths per 1,000 fire incidents is 3. This indicator was the highest - 29 in 2005, and the lowest 0 in 2002. The trend for deaths per 1,000 incidents is constant. Compared to the state value the number of deaths per 1,000 fire incidents is similar.
According to the reports from the years 2002 - 2018 the average number of fire-related yearly deaths is 0. The highest number of deaths - 2 took place in 2014, and the lowest - 0 in 2002. The data has a constant trend.
The average number of deaths per 1,000 fire incidents is 3. This indicator was the highest - 29 in 2005, and the lowest 0 in 2002. The trend for deaths per 1,000 incidents is constant. Compared to the state value the number of deaths per 1,000 fire incidents is similar.
 According to the data from the years 2002 - 2018 the average number of fire-related casualties per year is 5. The highest number of reported casualties - 12 took place in 2007, and the lowest - 0 in 2002. The data has a rising trend.
The average number of casualties per 1,000 fires is 27. This indicator was the highest - 57 in 2005, and the lowest 0 in 2002. The trend for injuries per 1,000 fires is increasing. Compared to the state value the number of casualties per 1,000 fires is much higher.
According to the data from the years 2002 - 2018 the average number of fire-related casualties per year is 5. The highest number of reported casualties - 12 took place in 2007, and the lowest - 0 in 2002. The data has a rising trend.
The average number of casualties per 1,000 fires is 27. This indicator was the highest - 57 in 2005, and the lowest 0 in 2002. The trend for injuries per 1,000 fires is increasing. Compared to the state value the number of casualties per 1,000 fires is much higher.Casualties per 1,000 incidents in Middletown, OH compared to nearest cities:
(Note: Based on data for all years, including only cities with at least 500 fire incidents)
| Middletown: | 30.9 |
| Monroe: | 20.9 |
| Trenton: | 7.3 |
| Franklin: | 21.5 |
| Carlisle: | 31.9 |
| Germantown: | 28.0 |
| Springboro: | 11.8 |
| Miamisburg: | 14.3 |
| Mason: | 5.4 |
 33.0% incidents where reported in the morning and 67.0% in the evening. The most fires (16.0%) took place on Tuesday, and the least (13.1%) on Wednesday.
 Based on the 2,815 fire incidents from years 2002 - 2018 most fires (10.1%) took place during August, and the least (6.7%) in January.
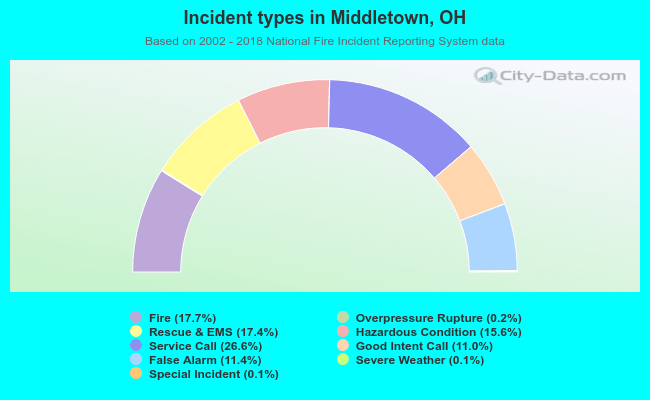 Out of all 15,947 cases reported during the years 2002 - 2018, the most belonged to the categories: Service Call (26.6%), Fire (17.7%), and Rescue & EMS (17.4%).
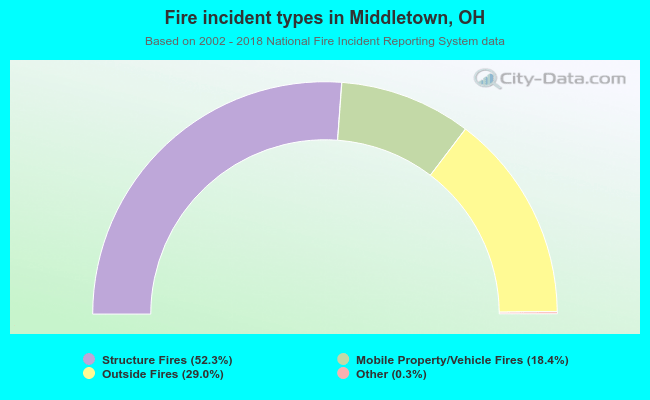 When looking into fire subcategories, the most incidents belonged to: Structure Fires (52.3%), and Outside Fires (29.0%).