Dayton: Fire Incidents, Ohio (OH)
Where are fire incidents reported in Dayton, OH
Something went wrong! Please refresh the page.
| Fire incidents reported | |
|---|---|
| Sreet name | Count |
| THIRD ST | 464 |
| MAIN ST | 392 |
| FIFTH ST | 266 |
| N MAIN ST | 212 |
| SALEM AVE | 208 |
| GETTYSBURG AVE | 198 |
| N DIXIE DR | 176 |
| SECOND ST | 152 |
| WILMINGTON AVE | 148 |
| MIAMISBURG-CENTERVILLE RD | 142 |
| IRWIN ST | 130 |
| NEEDMORE RD | 130 |
| TROY ST | 130 |
| GRAND AVE | 128 |
| HUFFMAN AVE | 116 |
| WYOMING ST | 104 |
| SMITHVILLE RD | 102 |
| BURKHARDT AVE | 98 |
| GERMANTOWN ST | 98 |
| RIVERVIEW AVE | 98 |
| RIVERSIDE DR | 92 |
| STEWART ST | 92 |
| XENIA AVE | 92 |
| UNION RD | 90 |
| HARBINE AVE | 86 |
| JAMES H MCGEE BLVD | 86 |
| FAIRFIELD RD | 82 |
| FIRST ST | 82 |
| FOURTH ST | 82 |
| VALLEY ST | 82 |
| Other | 7,862 |
2002 - 2018 National Fire Incident Reporting System (NFIRS) incidents
- Incident types reported to NFIRS in Dayton, OH
- 39,50343.5%Rescue & EMS
- 12,22013.4%Fire
- 11,95813.2%Hazardous Condition
- 10,23311.3%Good Intent Call
- 9,58810.5%False Alarm
- 6,7487.4%Service Call
- 3590.4%Special Incident
- 2440.3%Overpressure Rupture
- Fire incident types reported to NFIRS in Dayton, OH
- 5,74547.0%Structure Fires
- 4,37335.8%Outside Fires
- 2,05216.8%Mobile Property/Vehicle Fires
- 500.4%Other
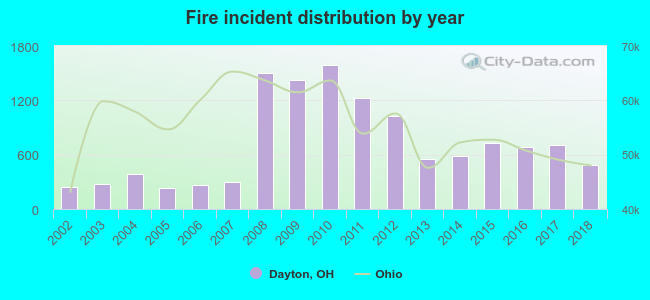 According to the data from the years 2002 - 2018 the average number of fires per year is 719. The highest number of reported fires - 1,589 took place in 2010, and the least - 229 in 2005. The data has a growing trend.
The average number of yearly fire incidents per 10k residents in Dayton, OH compared to nearest cities:
(Note: Based on data for the last 3 years, including only cities with population 5,000 and above)
| Dayton: | 44.3 |
| Oakwood: | 46.2 |
| Shiloh: | 12.6 |
| Riverside: | 20.2 |
| Moraine: | 108.9 |
| Kettering: | 14.8 |
| Trotwood: | 55.3 |
| West Carrollton: | 35.8 |
| West Carrollton City: | 1.2 |
 The median response time based on all reported fire incidents is 5 minutes. This is lower than the state median value.
The median response time in Dayton, OH compared to nearest cities:
(Note: Based on data for all years, including only cities with at least 500 fire incidents)
| Dayton: | 5 minutes |
| Oakwood: | 5 minutes |
| Riverside: | 6 minutes |
| Moraine: | 5 minutes |
| Kettering: | 6 minutes |
| Trotwood: | 7 minutes |
| West Carrollton: | 5 minutes |
| Huber Heights: | 6 minutes |
| Beavercreek: | 6 minutes |
 According to the reports from the years 2002 - 2018 the average number of fire-related fatalities per year is 2. The highest number of reported deaths - 7 took place in 2008, and the lowest - 0 in 2004. The data has a constant trend.
The average number of deaths per 1,000 fires is 3. This indicator was the highest - 9 in 2013, and the lowest 0 in 2004. The trend for deaths per 1,000 fire incidents is decreasing. Compared to the state value the number of fatalities per 1,000 incidents is higher.
According to the reports from the years 2002 - 2018 the average number of fire-related fatalities per year is 2. The highest number of reported deaths - 7 took place in 2008, and the lowest - 0 in 2004. The data has a constant trend.
The average number of deaths per 1,000 fires is 3. This indicator was the highest - 9 in 2013, and the lowest 0 in 2004. The trend for deaths per 1,000 fire incidents is decreasing. Compared to the state value the number of fatalities per 1,000 incidents is higher.Deaths per 1,000 incidents in Dayton, OH compared to nearest cities:
(Note: Based on data for all years, including only cities with at least 2,500 fire incidents)
| Dayton: | 3.4 |
| Trotwood: | 3.5 |
| Middletown: | 2.1 |
| Springfield: | 2.3 |
 According to the data from the years 2002 - 2018 the average number of fire-related yearly casualties is 15. The highest number of reported injuries - 39 took place in 2009, and the lowest - 1 in 2006. The data has a rising trend.
The average number of injuries per 1,000 fires is 22. This indicator was the highest - 36 in 2002, and the lowest 4 in 2006. The trend for casualties per 1,000 fires is declining. Compared to the Ohio value the number of injuries per 1,000 fire incidents is higher.
According to the data from the years 2002 - 2018 the average number of fire-related yearly casualties is 15. The highest number of reported injuries - 39 took place in 2009, and the lowest - 1 in 2006. The data has a rising trend.
The average number of injuries per 1,000 fires is 22. This indicator was the highest - 36 in 2002, and the lowest 4 in 2006. The trend for casualties per 1,000 fires is declining. Compared to the Ohio value the number of injuries per 1,000 fire incidents is higher.Casualties per 1,000 incidents in Dayton, OH compared to nearest cities:
(Note: Based on data for all years, including only cities with at least 500 fire incidents)
| Dayton: | 20.5 |
| Oakwood: | 2.1 |
| Riverside: | 19.3 |
| Moraine: | 20.1 |
| Kettering: | 25.7 |
| Trotwood: | 34.2 |
| West Carrollton: | 23.9 |
| Huber Heights: | 35.6 |
| Beavercreek: | 36.2 |
 34.3% incidents where reported in the morning and 65.7% in the evening. The most fires (15.1%) took place on Sunday, and the least (13.2%) on Tuesday.
 Based on the 12,220 fire incidents from years 2002 - 2018 most fires (10.6%) took place during July, and the least (6.4%) in February.
 Out of all 90,899 cases reported during the years 2002 - 2018, the most belonged to the categories: Rescue & EMS (43.5%), Fire (13.4%), and Hazardous Condition (13.2%).
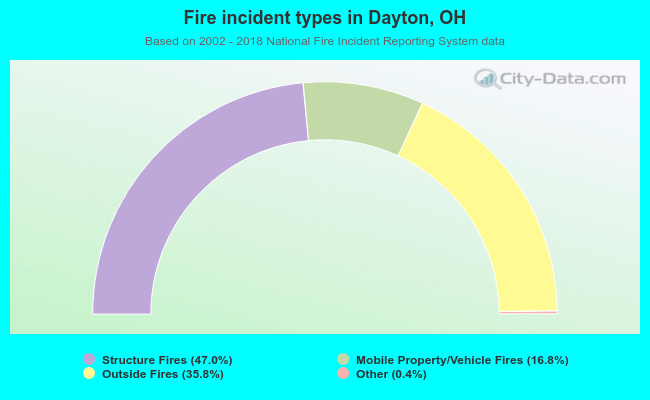 When looking into fire subcategories, the most reports belonged to: Structure Fires (47.0%), and Outside Fires (35.8%).