Moraine: Fire Incidents, Ohio (OH)
Where are fire incidents reported in Moraine, OH
Something went wrong! Please refresh the page.
| Fire incidents reported | |
|---|---|
| Sreet name | Count |
| CREEKWOOD CIR | 486 |
| COBBLE CIR | 336 |
| DRYDEN RD | 206 |
| SPRINGBORO PIKE | 104 |
| INTERSTATE 75 FWY | 70 |
| PINNACLE RD | 68 |
| SOUTH DIXIE HWY | 58 |
| KETTERING BLVD | 52 |
| ARBOR BLVD | 48 |
| INTERSTATE 75 HWY | 48 |
| PENSACOLA BLVD | 48 |
| WEST DOROTHY LANE | 48 |
| GLADSTONE ST | 46 |
| SPRINGBORO WEST PIKE | 44 |
| COBBLEGATE DR | 40 |
| MAIN ST | 38 |
| DIXIE DR | 36 |
| GERMANTOWN PIKE | 36 |
| LAUDERDALE DR | 36 |
| STROOP RD | 36 |
| BEECHGROVE RD | 34 |
| COZY CAMP RD | 34 |
| BLANCHARD AVE | 32 |
| SANDRIDGE DR | 32 |
| HEMPLE RD | 30 |
| CLEARVIEW RD | 28 |
| HOLMAN ST | 28 |
| VANCE RD | 26 |
| RIVER RD | 22 |
| UNION RD | 22 |
2002 - 2018 National Fire Incident Reporting System (NFIRS) incidents
- Incident types reported to NFIRS in Moraine, OH
- 10,89266.0%Rescue & EMS
- 1,6389.9%Fire
- 1,5429.3%False Alarm
- 9315.6%Hazardous Condition
- 7394.5%Good Intent Call
- 7364.5%Service Call
- Fire incident types reported to NFIRS in Moraine, OH
- 93957.3%Structure Fires
- 42926.2%Outside Fires
- 26115.9%Mobile Property/Vehicle Fires
- 90.5%Other
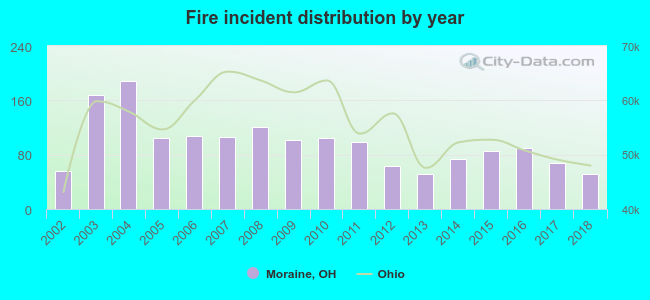 According to the data from the years 2002 - 2018 the average number of fire incidents per year is 96. The highest number of fires - 188 took place in 2004, and the least - 51 in 2018. The data has a decreasing trend.
The average number of yearly fire incidents per 10k residents in Moraine, OH compared to nearest cities:
(Note: Based on data for the last 3 years, including only cities with population 5,000 and above)
| Moraine: | 108.9 |
| West Carrollton: | 35.8 |
| West Carrollton City: | 1.2 |
| Oakwood: | 46.2 |
| Kettering: | 14.8 |
| Miamisburg: | 56.7 |
| Dayton: | 44.3 |
| Centerville: | 14.6 |
| Trotwood: | 55.3 |
 The median response time based on all reported fire incidents is 5 minutes. This is lower than the Ohio median value.
The median response time in Moraine, OH compared to nearest cities:
(Note: Based on data for all years, including only cities with at least 500 fire incidents)
| Moraine: | 5 minutes |
| West Carrollton: | 5 minutes |
| Oakwood: | 5 minutes |
| Kettering: | 6 minutes |
| Miamisburg: | 6 minutes |
| Dayton: | 5 minutes |
| Centerville: | 7 minutes |
| Trotwood: | 7 minutes |
| Riverside: | 6 minutes |
 According to the data from the years 2002 - 2018 the average number of fire-related casualties per year is 2. The highest number of reported casualties - 5 took place in 2003, and the lowest - 0 in 2006. The data has a decreasing trend.
The average number of casualties per 1,000 fires is 19. This indicator was the highest - 48 in 2010, and the lowest 0 in 2006. The trend for casualties per 1,000 fires is decreasing. Compared to the Ohio value the number of injuries per 1,000 fire incidents is higher.
According to the data from the years 2002 - 2018 the average number of fire-related casualties per year is 2. The highest number of reported casualties - 5 took place in 2003, and the lowest - 0 in 2006. The data has a decreasing trend.
The average number of casualties per 1,000 fires is 19. This indicator was the highest - 48 in 2010, and the lowest 0 in 2006. The trend for casualties per 1,000 fires is decreasing. Compared to the Ohio value the number of injuries per 1,000 fire incidents is higher.Casualties per 1,000 incidents in Moraine, OH compared to nearest cities:
(Note: Based on data for all years, including only cities with at least 500 fire incidents)
| Moraine: | 20.1 |
| West Carrollton: | 23.9 |
| Oakwood: | 2.1 |
| Kettering: | 25.7 |
| Miamisburg: | 14.3 |
| Dayton: | 20.5 |
| Centerville: | 33.9 |
| Trotwood: | 34.2 |
| Riverside: | 19.3 |
 32.9% incidents where reported in the morning and 67.1% in the evening. The most fires (15.3%) took place on Tuesday, and the least (13.4%) on Friday.
 Based on the 1,638 fires from years 2002 - 2018 most fires (10.4%) took place during April, and the least (5.5%) in February.
 Out of all 16,511 cases reported during the years 2002 - 2018, the most belonged to the categories: Rescue & EMS (66.0%), Fire (9.9%), and False Alarm (9.3%).
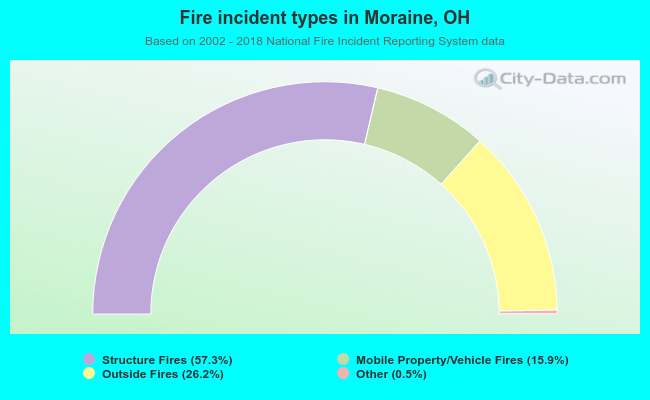 When looking into fire subcategories, the most incidents belonged to: Structure Fires (57.3%), and Outside Fires (26.2%).