Franklin: Fire Incidents, Ohio (OH)
Where are fire incidents reported in Franklin, OH
Something went wrong! Please refresh the page.
| Fire incidents reported | |
|---|---|
| Sreet name | Count |
| MAIN ST | 252 |
| 2ND ST | 112 |
| RIVER ST | 112 |
| I75 | 70 |
| 4TH ST | 60 |
| I-75 | 60 |
| OXFORD RD | 58 |
| 6TH ST | 56 |
| PARK AVE | 52 |
| BRIDGE ST | 50 |
| ST RT 123 | 50 |
| COMMERCE CENTER DR | 46 |
| INDUSTRIAL DR | 44 |
| DEARDOFF RD | 42 |
| HIGHRIDGE CT | 40 |
| BOULDER DR | 38 |
| LAKE AVE | 38 |
| BEAM DR | 34 |
| CONOVER DR | 32 |
| MAIN | 32 |
| ANDERSON ST | 30 |
| 5TH ST | 28 |
| BEAL RD | 28 |
| MAXWELL ST | 26 |
| VICTORY LN | 26 |
| CLAUDE THOMAS RD | 24 |
| MILLARD DR | 24 |
| SECOND ST | 24 |
| ST RT 73 | 24 |
| FOREST AVE | 22 |
| Other | 143 |
2002 - 2018 National Fire Incident Reporting System (NFIRS) incidents
- Incident types reported to NFIRS in Franklin, OH
- 3,38737.4%Hazardous Condition
- 1,67718.5%Fire
- 1,12612.4%Rescue & EMS
- 1,09012.0%Service Call
- 1,02511.3%Good Intent Call
- 7207.9%False Alarm
- 140.2%Overpressure Rupture
- 140.2%Severe Weather
- Fire incident types reported to NFIRS in Franklin, OH
- 88152.5%Structure Fires
- 45427.1%Outside Fires
- 33820.2%Mobile Property/Vehicle Fires
- 40.2%Other
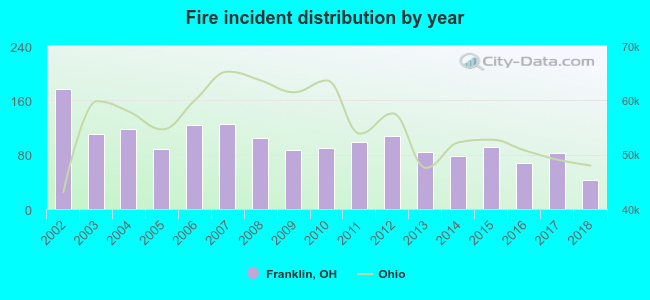 According to the data from the years 2002 - 2018 the average number of fire incidents per year is 99. The highest number of fire incidents - 177 took place in 2002, and the least - 42 in 2018. The data has a dropping trend.
The average number of yearly fire incidents per 10k residents in Franklin, OH compared to nearest cities:
(Note: Based on data for the last 3 years, including only cities with population 5,000 and above)
| Franklin: | 54.2 |
| Carlisle: | 41.7 |
| Springboro: | 20.9 |
| Middletown: | 44.0 |
| Miamisburg: | 56.7 |
| Germantown: | 65.4 |
| West Carrollton City: | 1.2 |
| West Carrollton: | 35.8 |
| Monroe: | 33.4 |
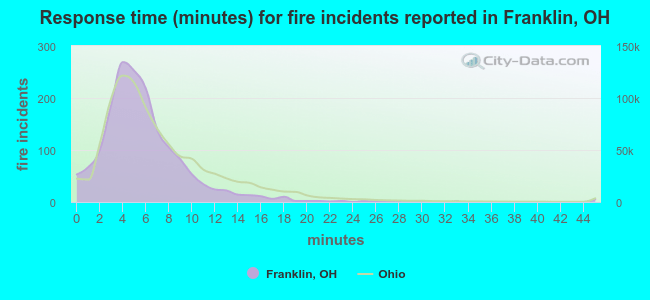 The median response time based on all reported fire incidents is 5 minutes. This is lower compared to the state median value.
The median response time in Franklin, OH compared to nearest cities:
(Note: Based on data for all years, including only cities with at least 500 fire incidents)
| Franklin: | 5 minutes |
| Carlisle: | 6 minutes |
| Springboro: | 6 minutes |
| Middletown: | 5 minutes |
| Miamisburg: | 6 minutes |
| Germantown: | 7 minutes |
| West Carrollton: | 5 minutes |
| Monroe: | 5 minutes |
| Centerville: | 7 minutes |
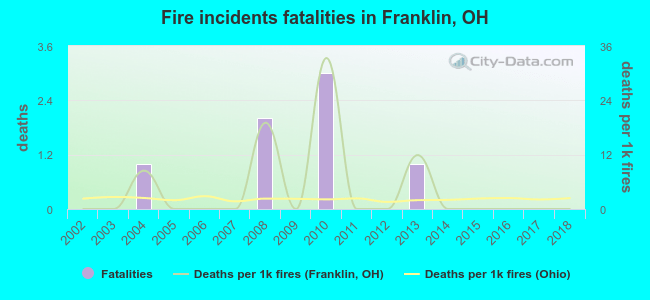 According to the reports from the years 2002 - 2018 the average number of fire-related yearly deaths is 0. The highest number of reported deaths - 3 took place in 2010, and the lowest - 0 in 2002. The data has a constant trend.
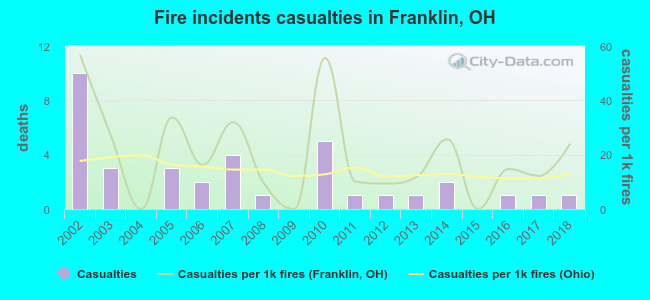 Based on the data from the years 2002 - 2018 the average number of fire-related yearly casualties is 2. The highest number of injuries - 10 took place in 2002, and the lowest - 0 in 2004. The data has a declining trend.
The average number of casualties per 1,000 fire incidents is 20. This indicator was the highest - 56 in 2002, and the lowest 0 in 2004. The trend for casualties per 1,000 fire incidents is declining. Compared to the Ohio value the number of injuries per 1,000 fire incidents is higher.
Based on the data from the years 2002 - 2018 the average number of fire-related yearly casualties is 2. The highest number of injuries - 10 took place in 2002, and the lowest - 0 in 2004. The data has a declining trend.
The average number of casualties per 1,000 fire incidents is 20. This indicator was the highest - 56 in 2002, and the lowest 0 in 2004. The trend for casualties per 1,000 fire incidents is declining. Compared to the Ohio value the number of injuries per 1,000 fire incidents is higher.Casualties per 1,000 incidents in Franklin, OH compared to nearest cities:
(Note: Based on data for all years, including only cities with at least 500 fire incidents)
| Franklin: | 21.5 |
| Carlisle: | 31.9 |
| Springboro: | 11.8 |
| Middletown: | 30.9 |
| Miamisburg: | 14.3 |
| Germantown: | 28.0 |
| West Carrollton: | 23.9 |
| Monroe: | 20.9 |
| Centerville: | 33.9 |
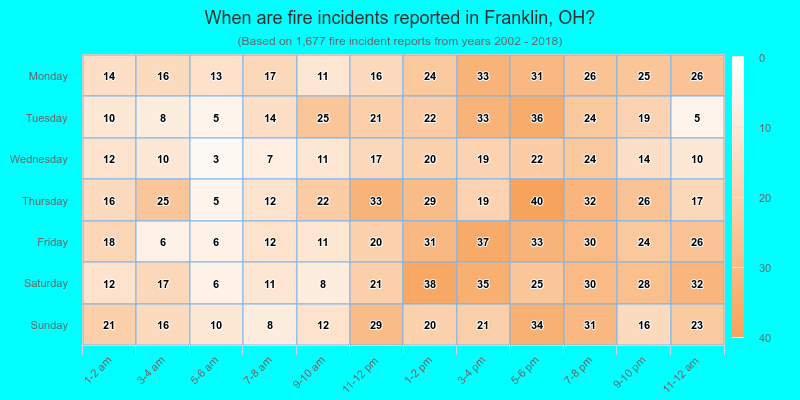
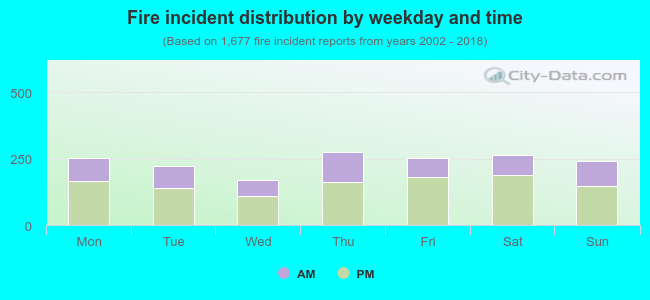 35.0% incidents where reported in the morning and 65.0% in the evening. The most fires (16.5%) took place on Thursday, and the least (10.1%) on Wednesday.
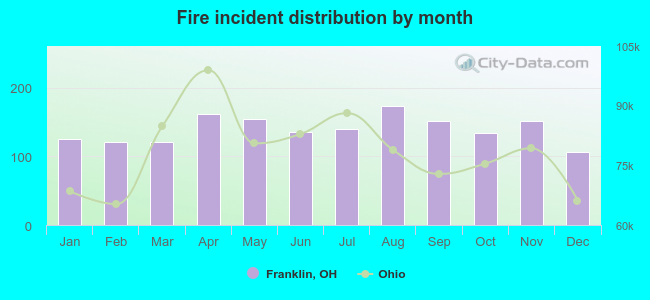 Based on the 1,677 fire incidents from years 2002 - 2018 most fires (10.4%) took place during August, and the least (6.3%) in December.
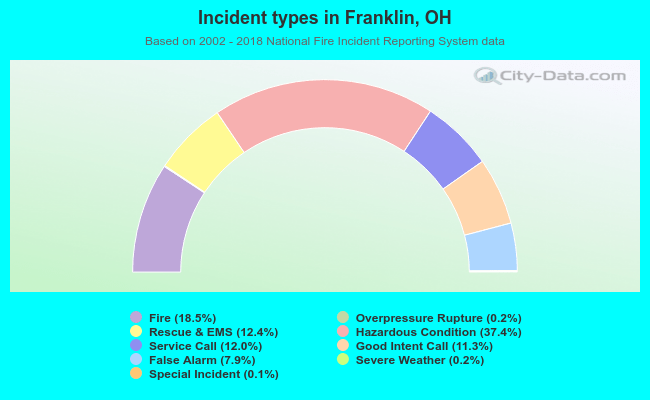 Out of all 9,059 cases reported during the years 2002 - 2018, the most belonged to the categories: Hazardous Condition (37.4%), Fire (18.5%), and Rescue & EMS (12.4%).
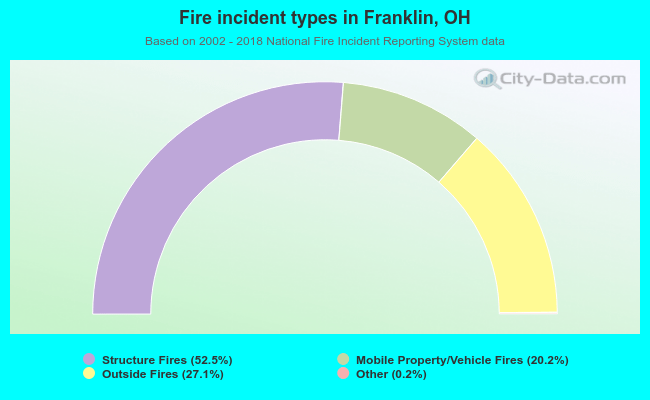 When looking into fire subcategories, the most incidents belonged to: Structure Fires (52.5%), and Outside Fires (27.1%).