Middletown: Fire Incidents, Delaware (DE)
Where are fire incidents reported in Middletown, DE
Something went wrong! Please refresh the page.
| Fire incidents reported | |
|---|---|
| Sreet name | Count |
| MAIN ST | 212 |
| BROAD ST | 150 |
| SUMMIT BRIDGE RD | 144 |
| COLE BLVD | 72 |
| BOYDS CORNER RD | 68 |
| DUPONT PKY | 68 |
| ROUTE 1 | 66 |
| CEDAR LANE RD | 64 |
| MIDDLETOWN-WARWICK RD | 64 |
| LOREWOOD GROVE RD | 56 |
| NEW ST | 56 |
| MIDDLETOWNWARWICK RD | 52 |
| RAMUNNO DR | 48 |
| CHOPTANK RD | 44 |
| BAYVIEW RD | 42 |
| CATHERINE ST | 40 |
| LAKE ST | 38 |
| LIBORIO DR | 38 |
| MIDDLETOWN WARWICK RD | 38 |
| HARVEST LN | 36 |
| LEVELS RD | 36 |
| PORT PENN RD | 34 |
| CHURCHTOWN RD | 32 |
| VANCE NECK RD | 32 |
| VINCENT CIR | 32 |
| FAIRFIELD CT | 30 |
| BUNKER HILL RD | 28 |
| COCHRAN ST | 28 |
| INDUSTRIAL DR | 28 |
| ASH BLVD | 26 |
| Other | 923 |
2002 - 2018 National Fire Incident Reporting System (NFIRS) incidents
- Incident types reported to NFIRS in Middletown, DE
- 3,66232.9%Rescue & EMS
- 2,62523.6%Fire
- 1,77315.9%Hazardous Condition
- 1,50113.5%Good Intent Call
- 1,11410.0%False Alarm
- 4233.8%Service Call
- 180.2%Special Incident
- 120.1%Severe Weather
- Fire incident types reported to NFIRS in Middletown, DE
- 1,50057.1%Structure Fires
- 67325.6%Outside Fires
- 37114.1%Mobile Property/Vehicle Fires
- 813.1%Other
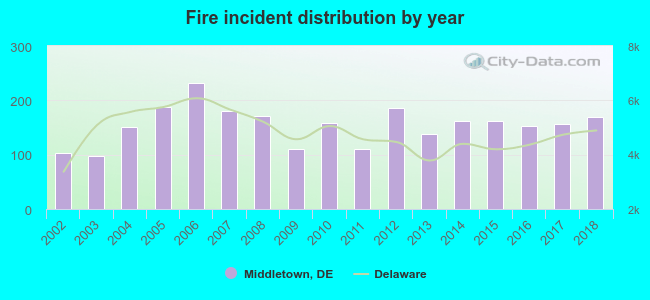 Based on the data from the years 2002 - 2018 the average number of fires per year is 154. The highest number of fires - 231 took place in 2006, and the least - 97 in 2003. The data has a rising trend.
The average number of yearly fire incidents per 10k residents in Middletown, DE compared to nearest cities:
(Note: Based on data for the last 3 years, including only cities with population 5,000 and above)
| Middletown: | 79.9 |
| Glasgow: | 1.4 |
| Bear: | 92.9 |
| Smyrna: | 80.6 |
| Newark: | 202.9 |
| New Castle: | 1,020.0 |
| Wilmington Manor: | 3.8 |
| Pike Creek: | 3.2 |
| Elsmere: | 19.0 |
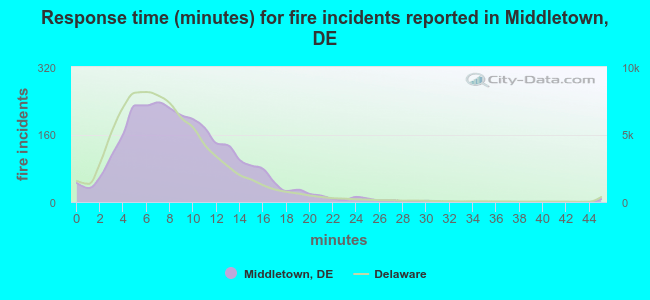 The median response time based on all reported fire incidents is 8 minutes. This is close to the Delaware median value.
The median response time in Middletown, DE compared to nearest cities:
(Note: Based on data for all years, including only cities with at least 500 fire incidents)
| Middletown: | 8 minutes |
| Townsend: | 9 minutes |
| Delaware City: | 8 minutes |
| Bear: | 9 minutes |
| Smyrna: | 7 minutes |
| Newark: | 8 minutes |
| New Castle: | 7 minutes |
| Wilmington: | 6 minutes |
| Dover: | 7 minutes |
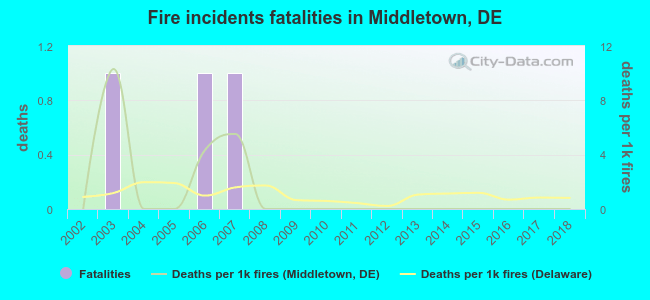 According to the data from the years 2002 - 2018 the average number of fire-related fatalities per year is 0. The highest number of deaths - 1 took place in 2003, and the lowest - 0 in 2002. The data has a constant trend.
The average number of deaths per 1,000 fires is 1. This indicator was the highest - 10 in 2003, and the lowest 0 in 2002. The trend for deaths per 1,000 fires is constant. Compared to the state value the number of fatalities per 1,000 fire incidents is about the same.
According to the data from the years 2002 - 2018 the average number of fire-related fatalities per year is 0. The highest number of deaths - 1 took place in 2003, and the lowest - 0 in 2002. The data has a constant trend.
The average number of deaths per 1,000 fires is 1. This indicator was the highest - 10 in 2003, and the lowest 0 in 2002. The trend for deaths per 1,000 fires is constant. Compared to the state value the number of fatalities per 1,000 fire incidents is about the same.Deaths per 1,000 incidents in Middletown, DE compared to nearest cities:
(Note: Based on data for all years, including only cities with at least 2,500 fire incidents)
| Middletown: | 1.1 |
| Bear: | 0.4 |
| Newark: | 1.2 |
| New Castle: | 1.7 |
| Wilmington: | 0.6 |
| Dover: | 0.9 |
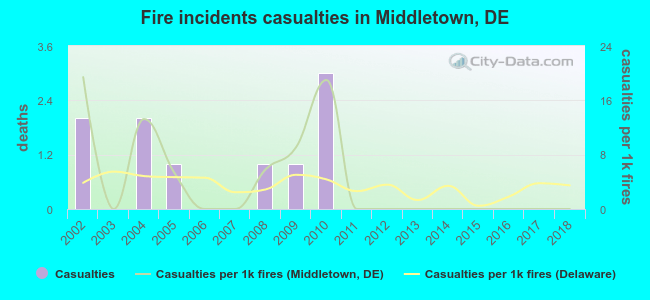 Based on the data from the years 2002 - 2018 the average number of fire-related casualties per year is 1. The highest number of reported casualties - 3 took place in 2010, and the lowest - 0 in 2003. The data has a declining trend.
The average number of casualties per 1,000 fires is 4. This indicator was the highest - 19 in 2002, and the lowest 0 in 2003. The trend for casualties per 1,000 incidents is declining. Compared to the Delaware value the number of injuries per 1,000 fires is about the same.
Based on the data from the years 2002 - 2018 the average number of fire-related casualties per year is 1. The highest number of reported casualties - 3 took place in 2010, and the lowest - 0 in 2003. The data has a declining trend.
The average number of casualties per 1,000 fires is 4. This indicator was the highest - 19 in 2002, and the lowest 0 in 2003. The trend for casualties per 1,000 incidents is declining. Compared to the Delaware value the number of injuries per 1,000 fires is about the same.Casualties per 1,000 incidents in Middletown, DE compared to nearest cities:
(Note: Based on data for all years, including only cities with at least 500 fire incidents)
| Middletown: | 3.8 |
| Townsend: | 4.1 |
| Delaware City: | 6.2 |
| Bear: | 6.0 |
| Smyrna: | 5.4 |
| Newark: | 2.2 |
| New Castle: | 3.4 |
| Wilmington: | 4.5 |
| Dover: | 7.0 |
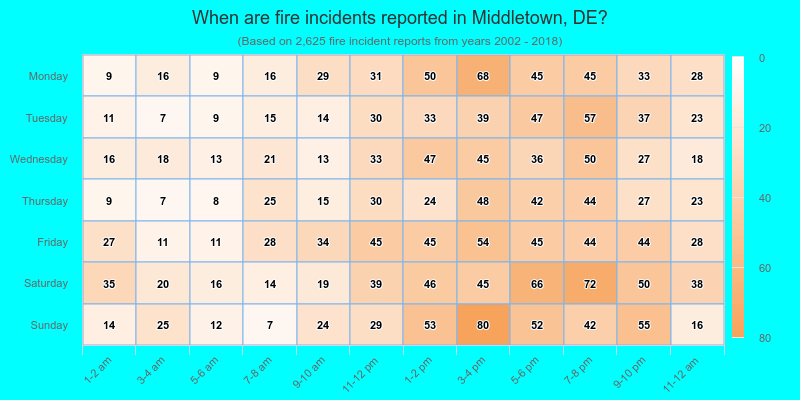
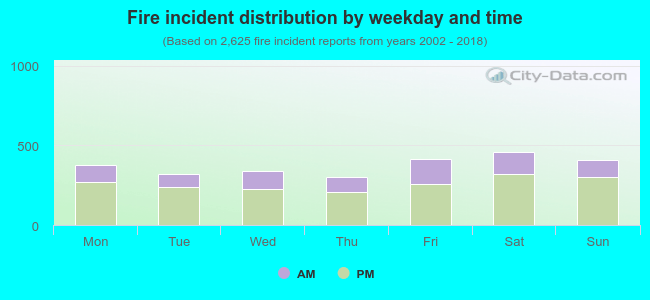 31.0% incidents where reported in the morning and 69.0% in the evening. The most fires (17.5%) took place on Saturday, and the least (11.5%) on Thursday.
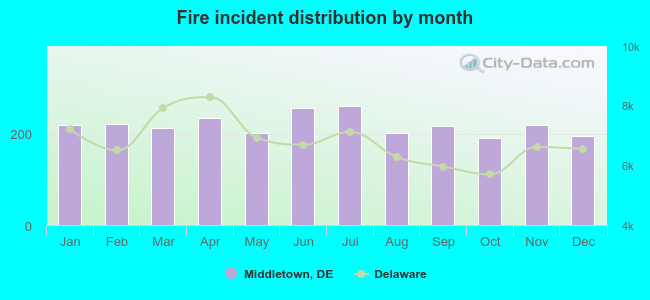 According to the 2,625 fire incident reports from years 2002 - 2018 most fires (9.9%) took place during July, and the least (7.3%) in October.
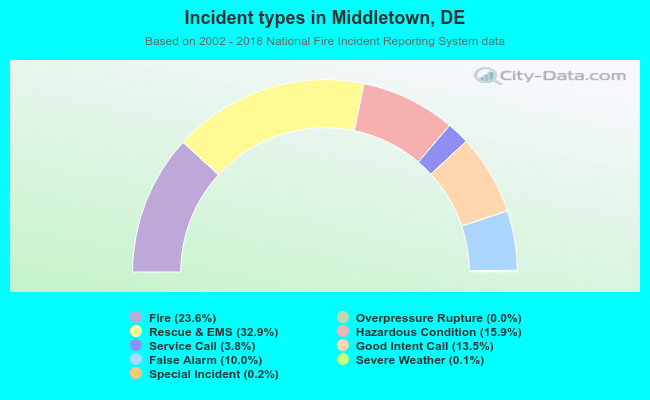 Out of all 11,132 cases reported during the years 2002 - 2018, the most belonged to the categories: Rescue & EMS (32.9%), Fire (23.6%), and Hazardous Condition (15.9%).
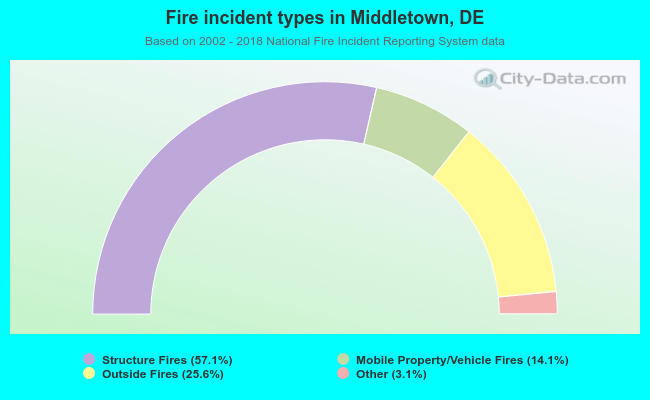 When looking into fire subcategories, the most incidents belonged to: Structure Fires (57.1%), and Outside Fires (25.6%).