Dover: Fire Incidents, Delaware (DE)
Where are fire incidents reported in Dover, DE
Something went wrong! Please refresh the page.
| Fire incidents reported | |
|---|---|
| Sreet name | Count |
| N DUPONT HWY | 550 |
| DUPONT HWY | 222 |
| S NEW ST | 114 |
| FORREST AVE | 112 |
| WHATCOAT DR | 108 |
| S FARMVIEW DR | 92 |
| S DUPONT HWY | 86 |
| CARVEL DR | 84 |
| BAYSIDE DR | 80 |
| HAMAN DR | 78 |
| WEBBS LA | 76 |
| S STATE ST | 74 |
| S GOVERNORS AVE | 70 |
| WEBBS LN | 68 |
| BAY RD | 60 |
| COUNTRY DR | 56 |
| COLLEGE RD | 54 |
| FAIRWAY LAKES DR | 54 |
| LITTLE CREEK RD | 54 |
| N STATE ST | 54 |
| WALKER RD | 54 |
| DENNEYS RD | 52 |
| PEARSONS CORNER RD | 52 |
| STATE ST | 52 |
| COURT ST | 50 |
| WILLIS RD | 50 |
| KENTON RD | 48 |
| N GOVERNORS AVE | 48 |
| PORT MAHON RD | 48 |
| S QUEEN ST | 48 |
| Other | 1,647 |
2002 - 2018 National Fire Incident Reporting System (NFIRS) incidents
- Incident types reported to NFIRS in Dover, DE
- 4,29529.5%Fire
- 2,70118.5%Hazardous Condition
- 2,57317.7%False Alarm
- 2,41616.6%Rescue & EMS
- 1,51910.4%Good Intent Call
- 9566.6%Service Call
- 480.3%Severe Weather
- 290.2%Special Incident
- 270.2%Overpressure Rupture
- Fire incident types reported to NFIRS in Dover, DE
- 2,34154.5%Structure Fires
- 1,15726.9%Outside Fires
- 57313.3%Mobile Property/Vehicle Fires
- 2245.2%Other
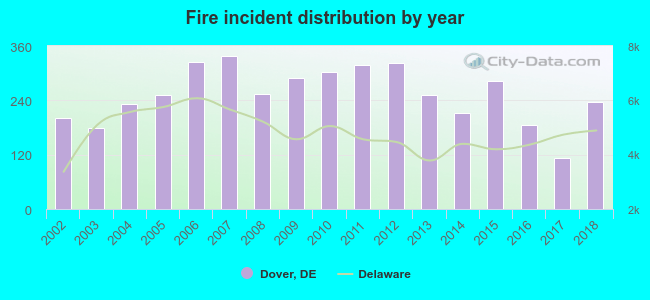 Based on the data from the years 2002 - 2018 the average number of fire incidents per year is 253. The highest number of reported fires - 339 took place in 2007, and the least - 113 in 2017. The data has an increasing trend.
The average number of yearly fire incidents per 10k residents in Dover, DE compared to nearest cities:
(Note: Based on data for the last 3 years, including only cities with population 5,000 and above)
| Dover: | 47.7 |
| Smyrna: | 80.6 |
| Milford: | 61.2 |
| Middletown: | 79.9 |
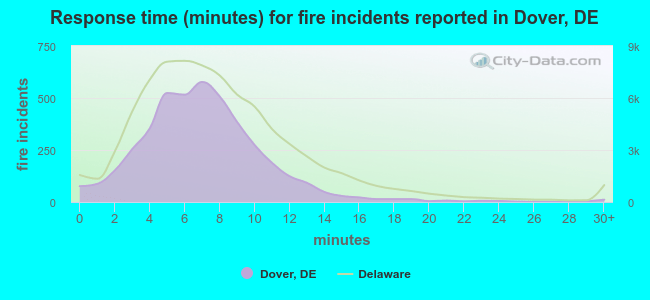 The median response time based on all reported fire incidents is 7 minutes. This is comparable to the Delaware median value.
The median response time in Dover, DE compared to nearest cities:
(Note: Based on data for all years, including only cities with at least 500 fire incidents)
| Dover: | 7 minutes |
| Magnolia: | 9 minutes |
| Smyrna: | 7 minutes |
| Felton: | 9 minutes |
| Harrington: | 8 minutes |
| Milford: | 9 minutes |
| Townsend: | 9 minutes |
| Middletown: | 8 minutes |
| Greenwood: | 10 minutes |
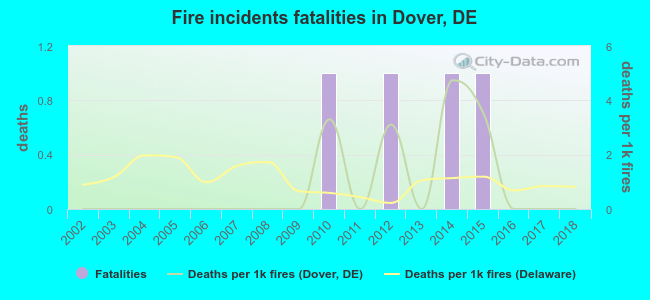 According to the data from the years 2002 - 2018 the average number of fire-related fatalities per year is 0. The highest number of deaths - 1 took place in 2010, and the lowest - 0 in 2002. The data has a constant trend.
The average number of fatalities per 1,000 fires is 1. This indicator was the highest - 5 in 2014, and the lowest 0 in 2002. The trend for fatalities per 1,000 fire incidents is constant. Compared to the state value the number of deaths per 1,000 fires is similar.
According to the data from the years 2002 - 2018 the average number of fire-related fatalities per year is 0. The highest number of deaths - 1 took place in 2010, and the lowest - 0 in 2002. The data has a constant trend.
The average number of fatalities per 1,000 fires is 1. This indicator was the highest - 5 in 2014, and the lowest 0 in 2002. The trend for fatalities per 1,000 fire incidents is constant. Compared to the state value the number of deaths per 1,000 fires is similar.Deaths per 1,000 incidents in Dover, DE compared to nearest cities:
(Note: Based on data for all years, including only cities with at least 2,500 fire incidents)
| Dover: | 0.9 |
| Middletown: | 1.1 |
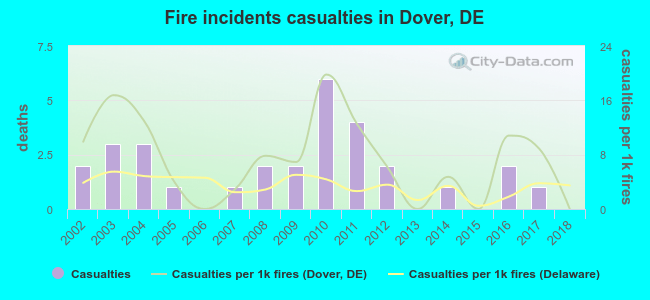 According to the reports from the years 2002 - 2018 the average number of fire-related yearly casualties is 2. The highest number of reported casualties - 6 took place in 2010, and the lowest - 0 in 2006. The data has a declining trend.
The average number of injuries per 1,000 fires is 7. This indicator was the highest - 20 in 2010, and the lowest 0 in 2006. The trend for casualties per 1,000 incidents is decreasing. Compared to the state value the number of injuries per 1,000 incidents is higher.
According to the reports from the years 2002 - 2018 the average number of fire-related yearly casualties is 2. The highest number of reported casualties - 6 took place in 2010, and the lowest - 0 in 2006. The data has a declining trend.
The average number of injuries per 1,000 fires is 7. This indicator was the highest - 20 in 2010, and the lowest 0 in 2006. The trend for casualties per 1,000 incidents is decreasing. Compared to the state value the number of injuries per 1,000 incidents is higher.Casualties per 1,000 incidents in Dover, DE compared to nearest cities:
(Note: Based on data for all years, including only cities with at least 500 fire incidents)
| Dover: | 7.0 |
| Magnolia: | 9.4 |
| Smyrna: | 5.4 |
| Felton: | 2.5 |
| Harrington: | 0.0 |
| Milford: | 3.6 |
| Townsend: | 4.1 |
| Middletown: | 3.8 |
| Greenwood: | 1.6 |
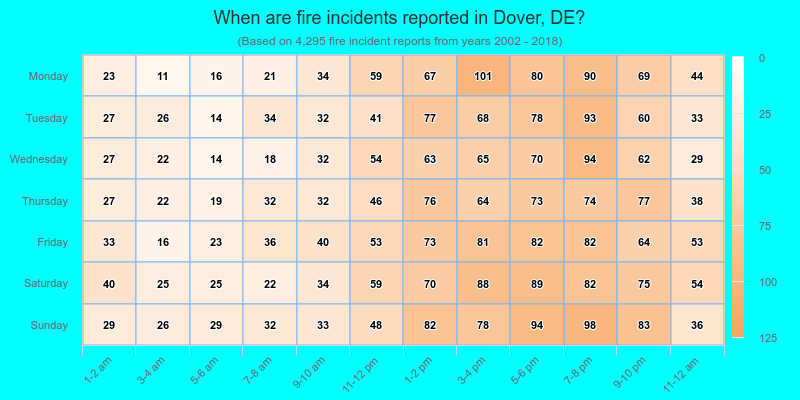
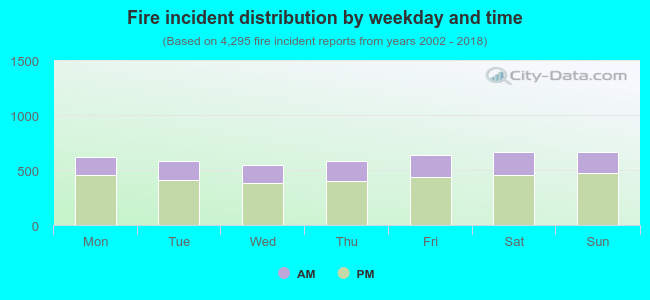 29.9% incidents where reported in the morning and 70.1% in the evening. The most fires (15.6%) took place on Sunday, and the least (12.8%) on Wednesday.
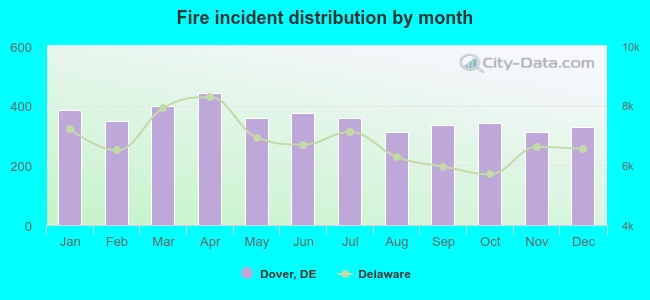 Based on the 4,295 reports from years 2002 - 2018 most fires (10.3%) took place during April, and the least (7.3%) in August.
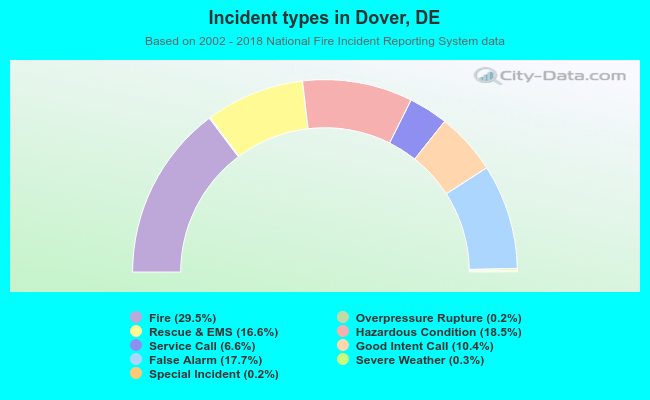 Out of all 14,564 cases reported during the years 2002 - 2018, the most belonged to the categories: Fire (29.5%), Hazardous Condition (18.5%), and False Alarm (17.7%).
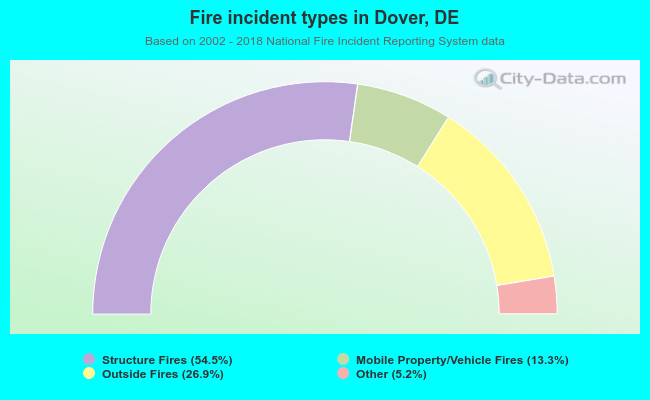 When looking into fire subcategories, the most reports belonged to: Structure Fires (54.5%), and Outside Fires (26.9%).