Wilmington: Fire Incidents, Delaware (DE)
Where are fire incidents reported in Wilmington, DE
Something went wrong! Please refresh the page.
| Fire incidents reported | |
|---|---|
| Sreet name | Count |
| KIRKWOOD HWY | 770 |
| CONCORD PIKE | 516 |
| KIRKWOOD HIGHWAY | 514 |
| MARKET ST | 418 |
| OLD CAPITOL TRL | 386 |
| COURT DRIVE | 322 |
| MARYLAND AVE | 316 |
| FOULK RD | 294 |
| BROOM ST | 288 |
| COURT DR | 288 |
| LIMESTONE RD | 274 |
| SHIPLEY RD | 262 |
| NEWPORT PIKE | 260 |
| HOMESTEAD RD | 252 |
| PHILADELPHIA PIKE | 246 |
| GREENBANK RD | 244 |
| 4TH ST | 240 |
| WEST ST | 240 |
| MARSH RD | 228 |
| SCARBOROUGH PARK DR | 226 |
| GRAFTON DR | 202 |
| NAAMANS RD | 194 |
| HAY RD | 192 |
| KENNETT PIKE | 186 |
| WASHINGTON ST | 182 |
| FRANKLIN ST | 178 |
| 5TH ST | 174 |
| CENTERVILLE RD | 174 |
| BONWOOD RD | 166 |
| HAVERFORD PL | 166 |
| Other | 13,036 |
2002 - 2018 National Fire Incident Reporting System (NFIRS) incidents
- Incident types reported to NFIRS in Wilmington, DE
- 83,37655.2%Rescue & EMS
- 21,43414.2%Fire
- 18,08712.0%Hazardous Condition
- 11,2917.5%Good Intent Call
- 9,7656.5%False Alarm
- 4,4582.9%Service Call
- 2,4561.6%Special Incident
- 2110.1%Overpressure Rupture
- Fire incident types reported to NFIRS in Wilmington, DE
- 14,01465.4%Structure Fires
- 4,19919.6%Outside Fires
- 1,7898.3%Mobile Property/Vehicle Fires
- 1,4326.7%Other
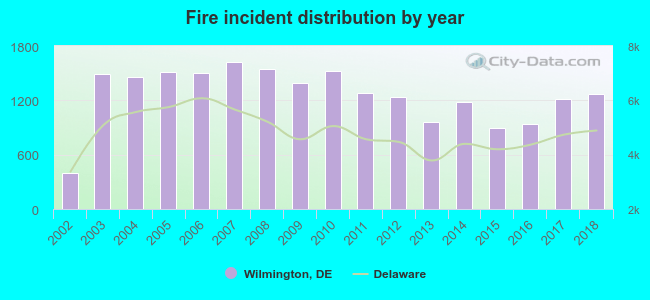 Based on the data from the years 2002 - 2018 the average number of fires per year is 1,261. The highest number of fires - 1,628 took place in 2007, and the least - 401 in 2002. The data has a rising trend.
The average number of yearly fire incidents per 10k residents in Wilmington, DE compared to nearest cities:
(Note: Based on data for the last 3 years, including only cities with population 5,000 and above)
| Wilmington: | 159.3 |
| Elsmere: | 19.0 |
| Wilmington Manor: | 3.8 |
| Claymont: | 122.0 |
| New Castle: | 1,020.0 |
| Hockessin: | 23.4 |
| Pike Creek: | 3.2 |
| Bear: | 92.9 |
| Newark: | 202.9 |
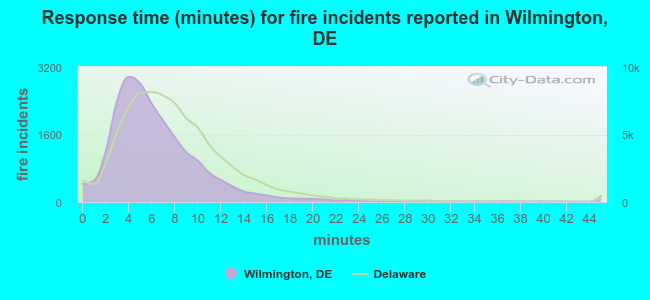 The median response time based on all reported fire incidents is 6 minutes. This is similar to the Delaware median value.
The median response time in Wilmington, DE compared to nearest cities:
(Note: Based on data for all years, including only cities with at least 500 fire incidents)
| Wilmington: | 6 minutes |
| Claymont: | 6 minutes |
| New Castle: | 7 minutes |
| Hockessin: | 8 minutes |
| Bear: | 9 minutes |
| Newark: | 8 minutes |
| Delaware City: | 8 minutes |
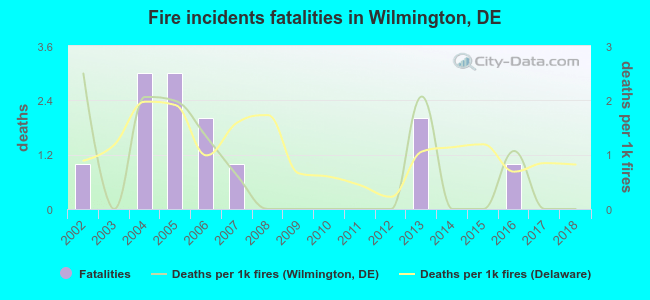 According to the data from the years 2002 - 2018 the average number of fire-related yearly deaths is 1. The highest number of reported deaths - 3 took place in 2004, and the lowest - 0 in 2003. The data has a declining trend.
The average number of deaths per 1,000 fire incidents is 1. This indicator was the highest - 2 in 2002, and the lowest 0 in 2003. The trend for fatalities per 1,000 fire incidents is decreasing. Compared to the state value the number of deaths per 1,000 incidents is lower.
According to the data from the years 2002 - 2018 the average number of fire-related yearly deaths is 1. The highest number of reported deaths - 3 took place in 2004, and the lowest - 0 in 2003. The data has a declining trend.
The average number of deaths per 1,000 fire incidents is 1. This indicator was the highest - 2 in 2002, and the lowest 0 in 2003. The trend for fatalities per 1,000 fire incidents is decreasing. Compared to the state value the number of deaths per 1,000 incidents is lower.Deaths per 1,000 incidents in Wilmington, DE compared to nearest cities:
(Note: Based on data for all years, including only cities with at least 2,500 fire incidents)
| Wilmington: | 0.6 |
| New Castle: | 1.7 |
| Bear: | 0.4 |
| Newark: | 1.2 |
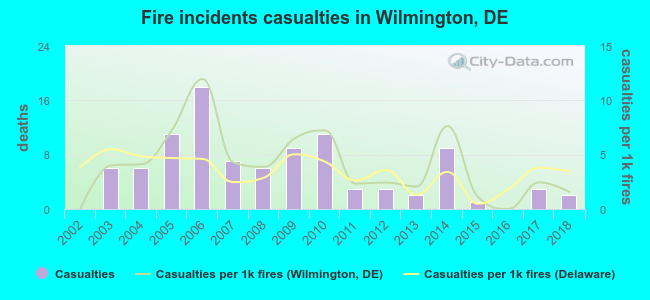 Based on the reports from the years 2002 - 2018 the average number of fire-related casualties per year is 6. The highest number of casualties - 18 took place in 2006, and the lowest - 0 in 2002. The data has a rising trend.
The average number of casualties per 1,000 fires is 4. This indicator was the highest - 12 in 2006, and the lowest 0 in 2002. The trend for casualties per 1,000 fires is rising. Compared to the Delaware value the number of injuries per 1,000 incidents is higher.
Based on the reports from the years 2002 - 2018 the average number of fire-related casualties per year is 6. The highest number of casualties - 18 took place in 2006, and the lowest - 0 in 2002. The data has a rising trend.
The average number of casualties per 1,000 fires is 4. This indicator was the highest - 12 in 2006, and the lowest 0 in 2002. The trend for casualties per 1,000 fires is rising. Compared to the Delaware value the number of injuries per 1,000 incidents is higher.Casualties per 1,000 incidents in Wilmington, DE compared to nearest cities:
(Note: Based on data for all years, including only cities with at least 500 fire incidents)
| Wilmington: | 4.5 |
| Claymont: | 6.4 |
| New Castle: | 3.4 |
| Hockessin: | 1.3 |
| Bear: | 6.0 |
| Newark: | 2.2 |
| Delaware City: | 6.2 |
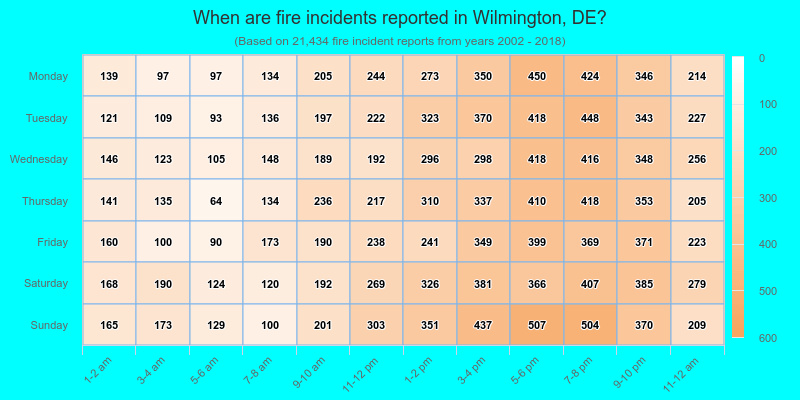
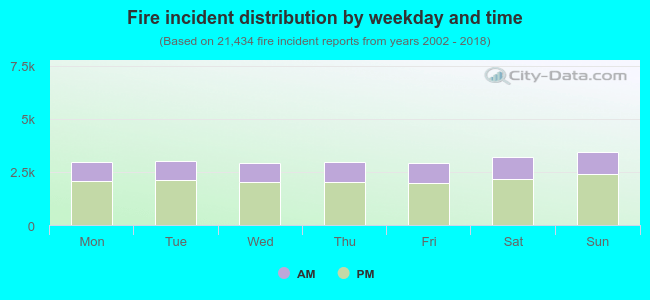 31.3% incidents where reported in the morning and 68.7% in the evening. The most fires (16.1%) took place on Sunday, and the least (13.5%) on Friday.
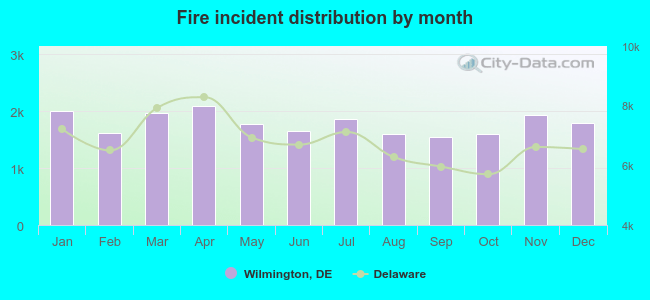 Based on the 21,434 fire incident reports from years 2002 - 2018 most fires (9.8%) took place during April, and the least (7.2%) in September.
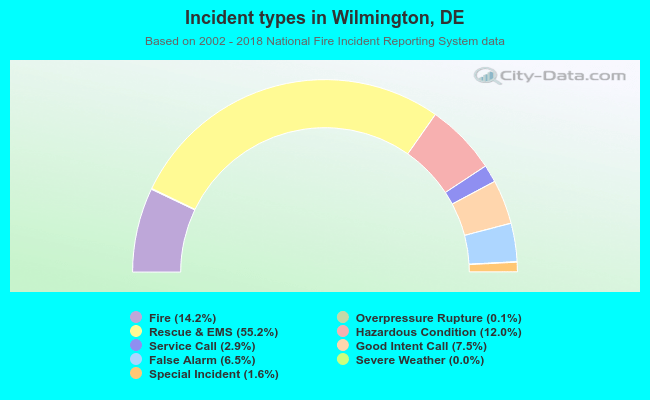 Out of all 151,152 cases reported during the years 2002 - 2018, the most belonged to the categories: Rescue & EMS (55.2%), Fire (14.2%), and Hazardous Condition (12.0%).
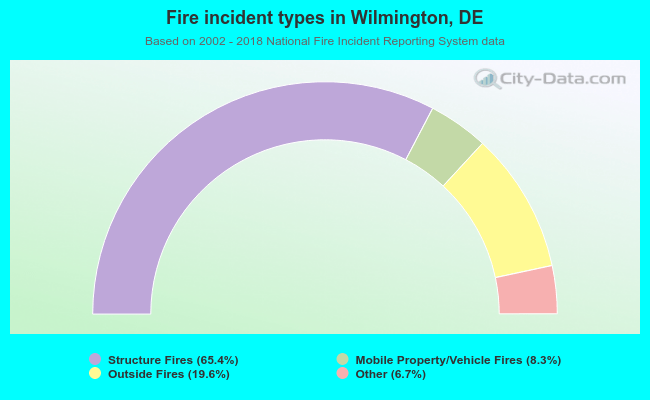 When looking into fire subcategories, the most incidents belonged to: Structure Fires (65.4%), and Outside Fires (19.6%).