Claymont: Fire Incidents, Delaware (DE)
Where are fire incidents reported in Claymont, DE
Something went wrong! Please refresh the page.
| Fire incidents reported | |
|---|---|
| Sreet name | Count |
| PHILADELPHIA PIKE | 352 |
| HARBOR DR | 194 |
| SOCIETY DR | 140 |
| NAAMANS RD | 116 |
| PEACHTREE RD | 116 |
| CEDARTREE LN | 98 |
| BALFOUR AVE | 76 |
| GOVERNOR PRINTZ BLVD | 76 |
| MONTCLAIR DR | 60 |
| PRINCETON AVE | 44 |
| FOURTH AVE | 40 |
| GREEN ST | 38 |
| CORAL DR | 34 |
| BAYARD DR | 32 |
| AVON DR | 30 |
| DARLEY RD | 30 |
| DENHAM AVE | 28 |
| SECOND AVE | 28 |
| APPLETREE CT | 26 |
| JACQUELINE DR | 26 |
| PEACHTREE DR | 24 |
| RIDGE RD | 24 |
| OSAGE RD | 22 |
| PENNSYLVANIA AVE | 22 |
| COURT ST | 20 |
| MELONTREE CT | 20 |
| HARVEY RD | 18 |
| PARKSIDE BLVD | 18 |
| DICKENS RD | 16 |
| LAWSON AVE | 16 |
2002 - 2018 National Fire Incident Reporting System (NFIRS) incidents
- Incident types reported to NFIRS in Claymont, DE
- 1,56630.1%Fire
- 1,32725.5%Rescue & EMS
- 87116.7%Hazardous Condition
- 70913.6%Good Intent Call
- 54010.4%False Alarm
- 1713.3%Service Call
- 150.3%Overpressure Rupture
- 70.1%Special Incident
- Fire incident types reported to NFIRS in Claymont, DE
- 97462.2%Structure Fires
- 30319.3%Outside Fires
- 17110.9%Other
- 1187.5%Mobile Property/Vehicle Fires
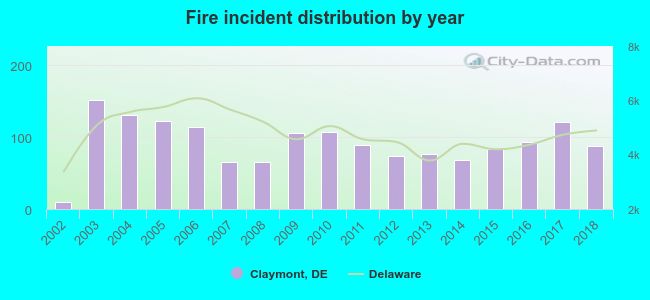 According to the data from the years 2002 - 2018 the average number of fires per year is 92. The highest number of reported fire incidents - 151 took place in 2003, and the least - 10 in 2002. The data has an increasing trend.
The average number of yearly fire incidents per 10k residents in Claymont, DE compared to nearest cities:
(Note: Based on data for the last 3 years, including only cities with population 5,000 and above)
| Claymont: | 122.0 |
| Wilmington: | 159.3 |
| Elsmere: | 19.0 |
| Wilmington Manor: | 3.8 |
| New Castle: | 1,020.0 |
| Hockessin: | 23.4 |
| Pike Creek: | 3.2 |
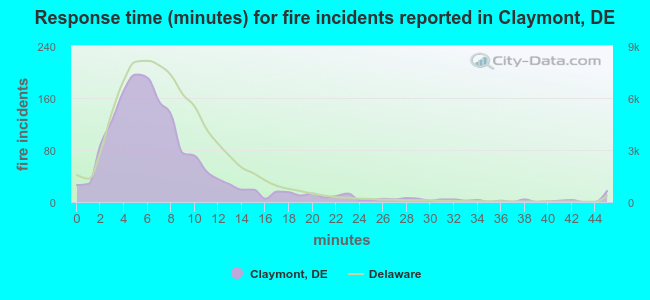 The median response time based on all reported fire incidents is 6 minutes. This is about the same as the state median value.
The median response time in Claymont, DE compared to nearest cities:
(Note: Based on data for all years, including only cities with at least 500 fire incidents)
| Claymont: | 6 minutes |
| Wilmington: | 6 minutes |
| New Castle: | 7 minutes |
| Hockessin: | 8 minutes |
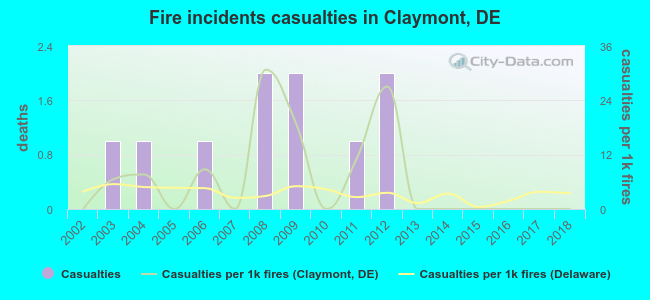 Based on the reports from the years 2002 - 2018 the average number of fire-related casualties per year is 1. The highest number of injuries - 2 took place in 2008, and the lowest - 0 in 2002. The data has a constant trend.
The average number of casualties per 1,000 fire incidents is 7. This indicator was the highest - 31 in 2008, and the lowest 0 in 2002. The trend for injuries per 1,000 incidents is constant. Compared to the Delaware value the number of injuries per 1,000 incidents is higher.
Based on the reports from the years 2002 - 2018 the average number of fire-related casualties per year is 1. The highest number of injuries - 2 took place in 2008, and the lowest - 0 in 2002. The data has a constant trend.
The average number of casualties per 1,000 fire incidents is 7. This indicator was the highest - 31 in 2008, and the lowest 0 in 2002. The trend for injuries per 1,000 incidents is constant. Compared to the Delaware value the number of injuries per 1,000 incidents is higher.Casualties per 1,000 incidents in Claymont, DE compared to nearest cities:
(Note: Based on data for all years, including only cities with at least 500 fire incidents)
| Claymont: | 6.4 |
| Wilmington: | 4.5 |
| New Castle: | 3.4 |
| Hockessin: | 1.3 |
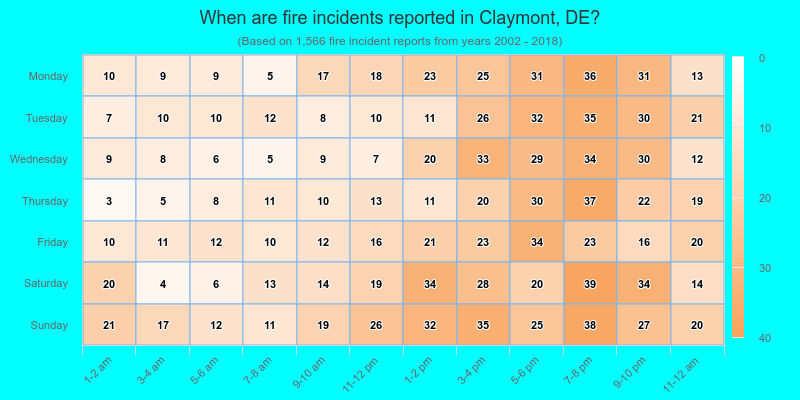
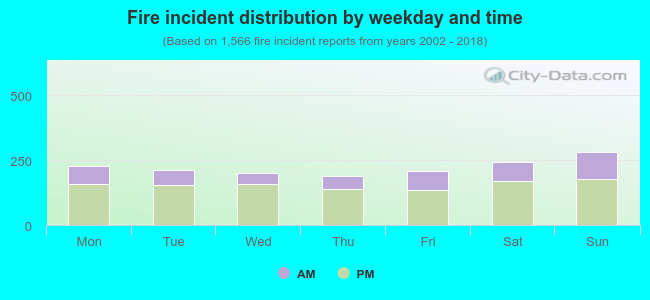 30.1% incidents where reported in the morning and 69.9% in the evening. The most fires (18.1%) took place on Sunday, and the least (12.1%) on Thursday.
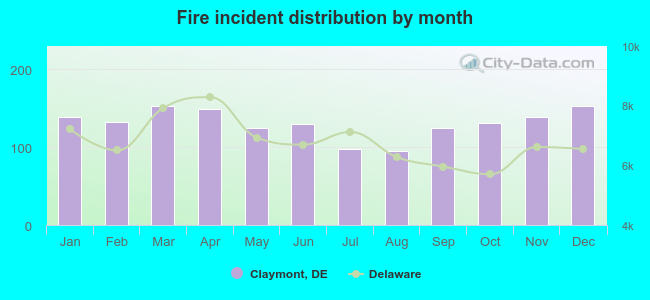 According to the 1,566 incident reports from years 2002 - 2018 most fires (9.8%) took place during March, and the least (6.1%) in August.
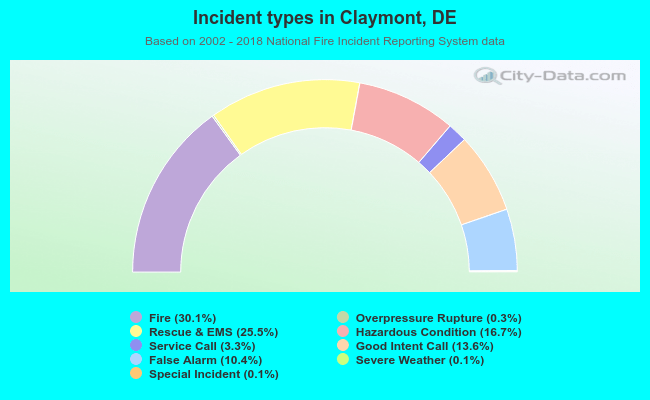 Out of all 5,209 cases reported during the years 2002 - 2018, the most belonged to the categories: Fire (30.1%), Rescue & EMS (25.5%), and Hazardous Condition (16.7%).
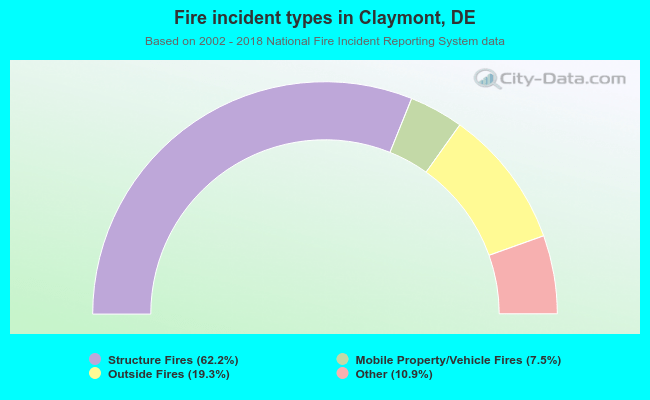 When looking into fire subcategories, the most incidents belonged to: Structure Fires (62.2%), and Outside Fires (19.3%).