Middleton: Fire Incidents, Massachusetts (MA)
Where are fire incidents reported in Middleton, MA
Something went wrong! Please refresh the page.
| Fire incidents reported | |
|---|---|
| Sreet name | Count |
| NO MAIN ST | 270 |
| ORCHARD CIR | 210 |
| FULLER POND RD | 130 |
| SO MAIN ST | 122 |
| VILLAGE RD | 104 |
| SOUTH MAIN ST | 88 |
| PEACHEY CIR | 86 |
| MASI MEADOW LN | 84 |
| ORCHARD CIR | 78 |
| SHELDON CIR | 64 |
| GREYSTONE DR | 62 |
| MILLS PT | 58 |
| NORTH MAIN ST | 58 |
| FULLER POND RD | 50 |
| MANNING AVE | 50 |
| MEETING HOUSE SQ | 48 |
| BOSTON ST | 46 |
| COUNTRY CLUB LN | 42 |
| FOREST ST | 40 |
| VILLAGE RD | 40 |
| BELLINGHAM CT | 38 |
| DANSEREAU PL | 38 |
| MAIN ST | 36 |
| MAPLE ST | 34 |
| MAPLE ST | 34 |
| LAKE ST | 32 |
| STONEY BROOK LN | 32 |
| LIBERTY ST | 28 |
| MANNING AVE | 26 |
| RIVER ST | 26 |
2002 - 2018 National Fire Incident Reporting System (NFIRS) incidents
- Incident types reported to NFIRS in Middleton, MA
- 3,19335.6%Rescue & EMS
- 1,63418.2%Fire
- 1,47516.4%False Alarm
- 1,09812.2%Service Call
- 1,02811.4%Hazardous Condition
- 5265.9%Good Intent Call
- 120.1%Special Incident
- Fire incident types reported to NFIRS in Middleton, MA
- 1,20173.5%Structure Fires
- 27216.6%Outside Fires
- 955.8%Other
- 664.0%Mobile Property/Vehicle Fires
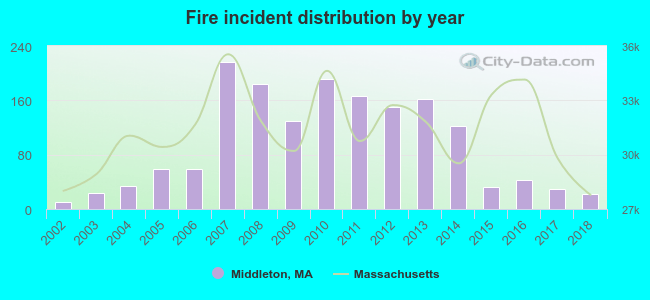 Based on the data from the years 2002 - 2018 the average number of fires per year is 96. The highest number of fires - 217 took place in 2007, and the least - 10 in 2002. The data has an increasing trend.
The average number of yearly fire incidents per 10k residents in Middleton, MA compared to nearest cities:
(Note: Based on data for the last 3 years, including only cities with population 5,000 and above)
| Middleton: | 34.9 |
| Danvers: | 40.5 |
| North Reading: | 24.2 |
| Lynnfield: | 81.9 |
| Peabody: | 23.0 |
| Reading: | 29.9 |
| Andover: | 113.4 |
| North Andover: | 38.9 |
| Wakefield: | 21.3 |
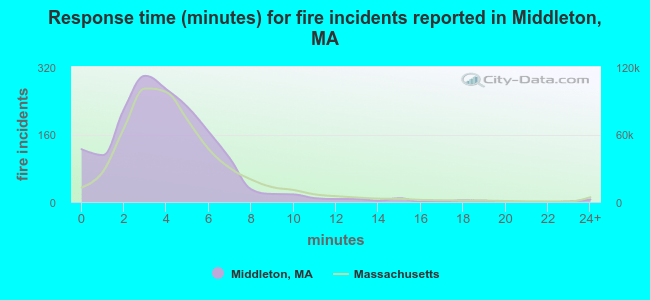 The median response time based on all reported fire incidents is 4 minutes. This is close to the state median value.
The median response time in Middleton, MA compared to nearest cities:
(Note: Based on data for all years, including only cities with at least 500 fire incidents)
| Middleton: | 4 minutes |
| Topsfield: | 4 minutes |
| Danvers: | 5 minutes |
| North Reading: | 4 minutes |
| Boxford: | 8 minutes |
| Lynnfield: | 5 minutes |
| Peabody: | 5 minutes |
| Reading: | 4 minutes |
| Andover: | 6 minutes |
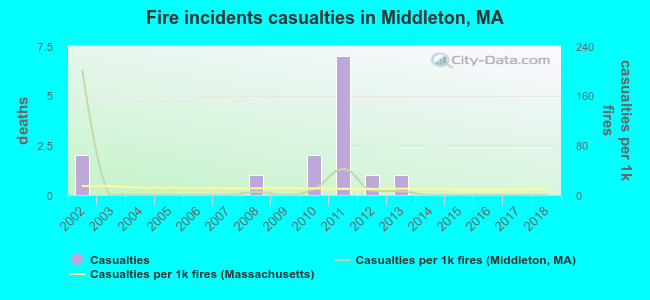 According to the data from the years 2002 - 2018 the average number of fire-related yearly casualties is 1. The highest number of casualties - 7 took place in 2011, and the lowest - 0 in 2003. The data has a dropping trend.
The average number of casualties per 1,000 fires is 16. This indicator was the highest - 200 in 2002, and the lowest 0 in 2003. The trend for injuries per 1,000 fire incidents is dropping. Compared to the Massachusetts value the number of casualties per 1,000 fire incidents is lower.
According to the data from the years 2002 - 2018 the average number of fire-related yearly casualties is 1. The highest number of casualties - 7 took place in 2011, and the lowest - 0 in 2003. The data has a dropping trend.
The average number of casualties per 1,000 fires is 16. This indicator was the highest - 200 in 2002, and the lowest 0 in 2003. The trend for injuries per 1,000 fire incidents is dropping. Compared to the Massachusetts value the number of casualties per 1,000 fire incidents is lower.
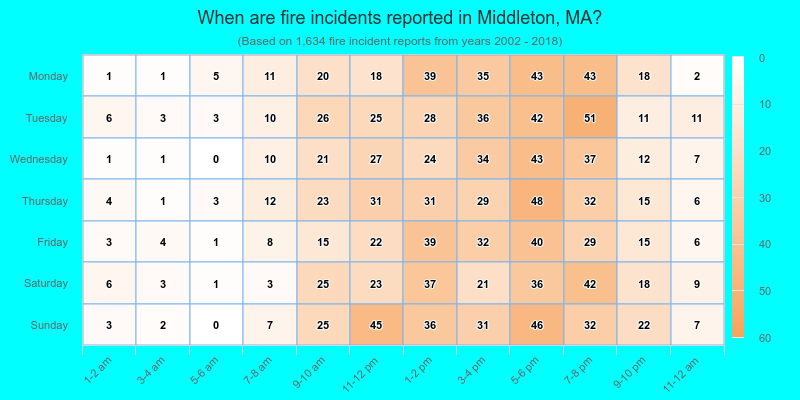
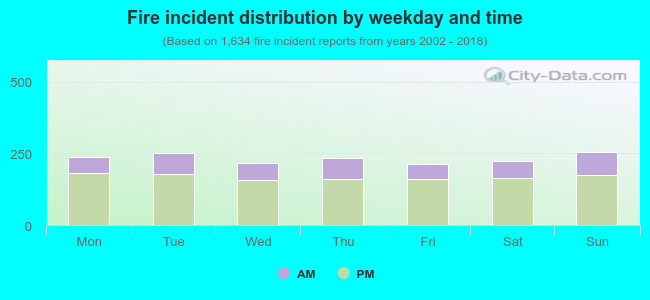 28.1% incidents where reported in the morning and 71.9% in the evening. The most fires (15.7%) took place on Sunday, and the least (13.1%) on Friday.
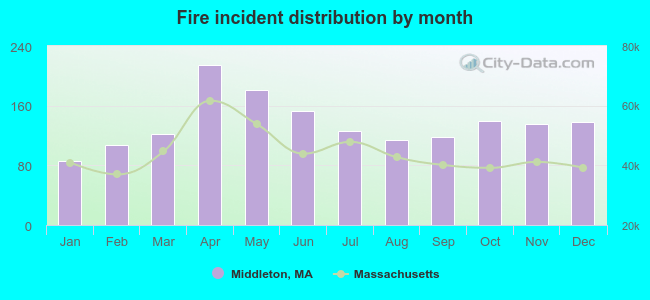 Based on the 1,634 fires from years 2002 - 2018 most fires (13.1%) took place during April, and the least (5.3%) in January.
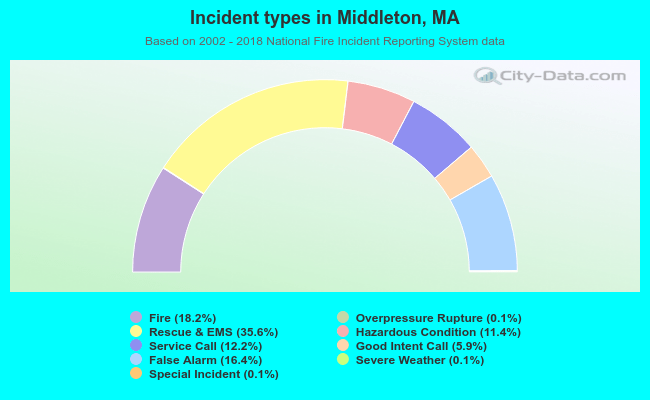 Out of all 8,979 cases reported during the years 2002 - 2018, the most belonged to the categories: Rescue & EMS (35.6%), Fire (18.2%), and False Alarm (16.4%).
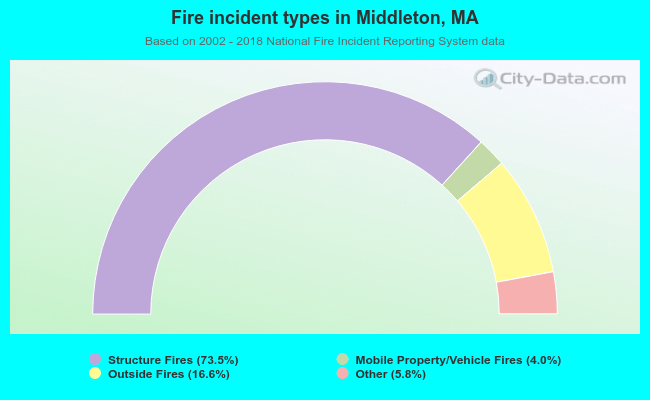 When looking into fire subcategories, the most reports belonged to: Structure Fires (73.5%), and Outside Fires (16.6%).