North Reading: Fire Incidents, Massachusetts (MA)
Where are fire incidents reported in North Reading, MA
Something went wrong! Please refresh the page.
| Fire incidents reported | |
|---|---|
| Sreet name | Count |
| MAIN ST | 228 |
| PARK ST | 122 |
| PEABODY CT | 92 |
| NORTH ST | 68 |
| ELM ST | 66 |
| HAVERHILL ST | 62 |
| LOWELL RD | 60 |
| CENTRAL ST | 52 |
| CHESTNUT ST | 52 |
| CONCORD ST | 42 |
| MARBLEHEAD ST | 36 |
| SWAN POND RD | 32 |
| GREENBRIAR DR | 28 |
| WINTER ST | 20 |
| RIVERPARK DR | 18 |
| MID IRON DR | 16 |
| MUTIAL AID TO N. READING | 16 |
| MOUNT VERNON ST | 14 |
| TOWER HILL RD | 14 |
| FOLEY DR | 12 |
| BIGHAM RD | 10 |
| LINWOOD AVE | 10 |
| MARSHALL ST | 10 |
| MT VERNON ST | 10 |
| OLD ANDOVER RD | 10 |
| SHASTA DR | 10 |
| WASHINGTON ST | 10 |
| WRIGHT ST | 10 |
| ABBOTT RD | 8 |
| COLD SPRING RD | 8 |
2002 - 2018 National Fire Incident Reporting System (NFIRS) incidents
- Incident types reported to NFIRS in North Reading, MA
- 4,99542.2%Rescue & EMS
- 1,90916.1%Hazardous Condition
- 1,88515.9%Service Call
- 1,29610.9%False Alarm
- 8927.5%Fire
- 7316.2%Good Intent Call
- 900.8%Severe Weather
- 350.3%Special Incident
- 150.1%Overpressure Rupture
- Fire incident types reported to NFIRS in North Reading, MA
- 46351.9%Structure Fires
- 28632.1%Outside Fires
- 829.2%Mobile Property/Vehicle Fires
- 616.8%Other
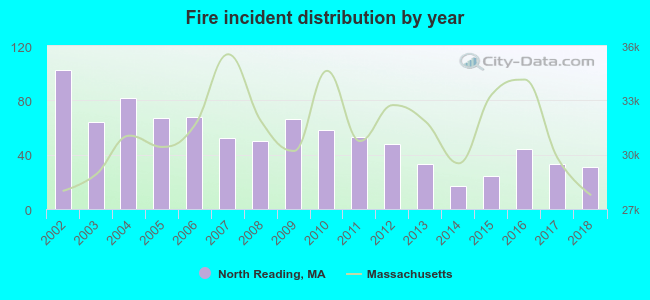 According to the data from the years 2002 - 2018 the average number of fire incidents per year is 52. The highest number of reported fire incidents - 102 took place in 2002, and the least - 17 in 2014. The data has a dropping trend.
The average number of yearly fire incidents per 10k residents in North Reading, MA compared to nearest cities:
(Note: Based on data for the last 3 years, including only cities with population 5,000 and above)
| North Reading: | 24.2 |
| Reading: | 29.9 |
| Wilmington: | 23.6 |
| Middleton: | 34.9 |
| Lynnfield: | 81.9 |
| Andover: | 113.4 |
| Wakefield: | 21.3 |
| Tewksbury: | 29.8 |
| North Andover: | 38.9 |
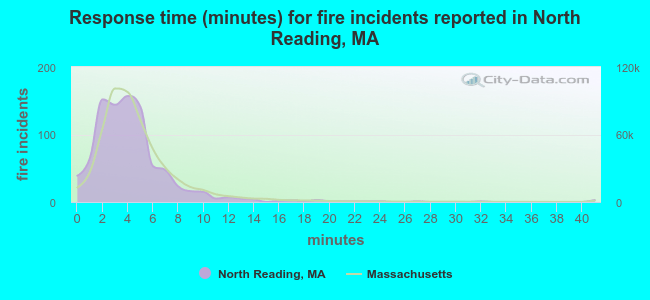 The median response time based on all reported fire incidents is 4 minutes. This is similar to the state median value.
The median response time in North Reading, MA compared to nearest cities:
(Note: Based on data for all years, including only cities with at least 500 fire incidents)
| North Reading: | 4 minutes |
| Reading: | 4 minutes |
| Wilmington: | 6 minutes |
| Middleton: | 4 minutes |
| Lynnfield: | 5 minutes |
| Andover: | 6 minutes |
| Wakefield: | 2 minutes |
| Tewksbury: | 4 minutes |
| North Andover: | 4 minutes |
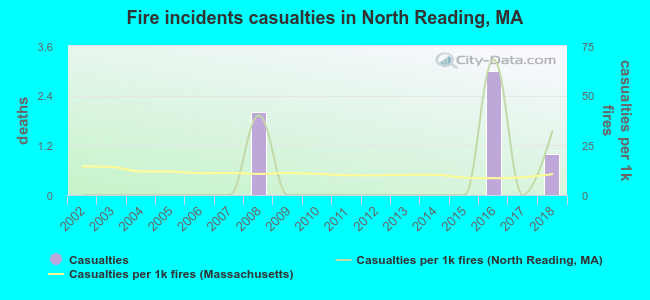 Based on the data from the years 2002 - 2018 the average number of fire-related casualties per year is 0. The highest number of injuries - 3 took place in 2016, and the lowest - 0 in 2002. The data has a rising trend.
The average number of casualties per 1,000 fire incidents is 8. This indicator was the highest - 68 in 2016, and the lowest 0 in 2002. The trend for injuries per 1,000 fire incidents is increasing. Compared to the state value the number of injuries per 1,000 fires is lower.
Based on the data from the years 2002 - 2018 the average number of fire-related casualties per year is 0. The highest number of injuries - 3 took place in 2016, and the lowest - 0 in 2002. The data has a rising trend.
The average number of casualties per 1,000 fire incidents is 8. This indicator was the highest - 68 in 2016, and the lowest 0 in 2002. The trend for injuries per 1,000 fire incidents is increasing. Compared to the state value the number of injuries per 1,000 fires is lower.Casualties per 1,000 incidents in North Reading, MA compared to nearest cities:
(Note: Based on data for all years, including only cities with at least 500 fire incidents)
| North Reading: | 6.7 |
| Reading: | 5.2 |
| Wilmington: | 10.0 |
| Middleton: | 8.6 |
| Lynnfield: | 2.5 |
| Andover: | 1.0 |
| Wakefield: | 5.8 |
| Tewksbury: | 3.2 |
| North Andover: | 5.9 |
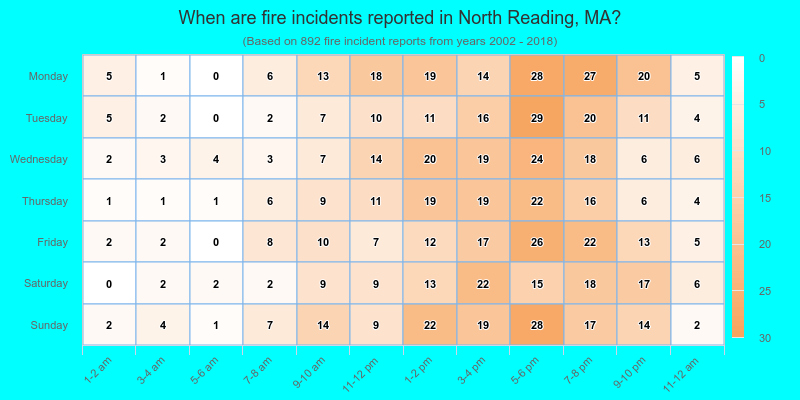
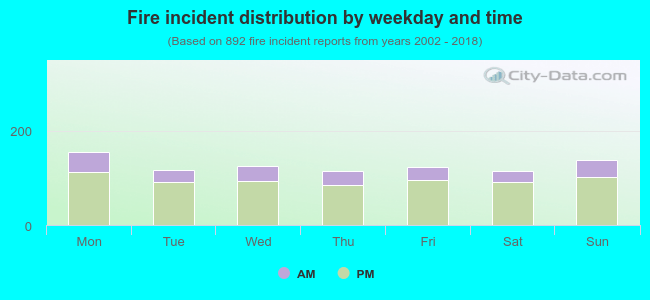 24.8% incidents where reported in the morning and 75.2% in the evening. The most fires (17.5%) took place on Monday, and the least (12.9%) on Thursday.
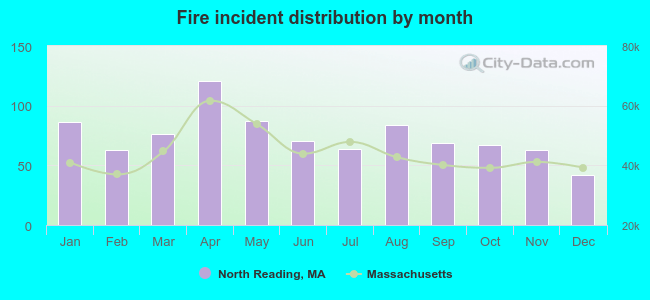 Based on the 892 fire incident reports from years 2002 - 2018 most fires (13.6%) took place during April, and the least (4.7%) in December.
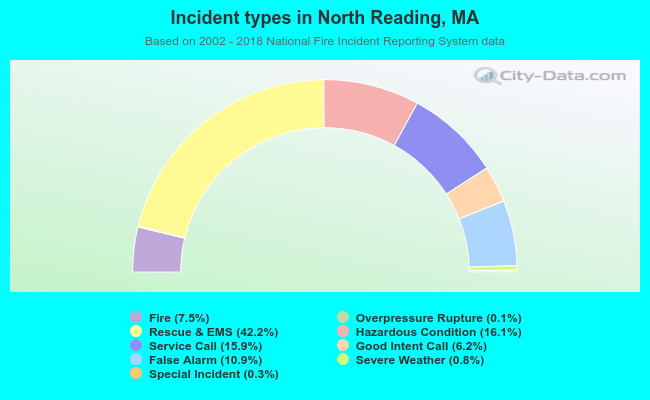 Out of all 11,848 cases reported during the years 2002 - 2018, the most belonged to the categories: Rescue & EMS (42.2%), Hazardous Condition (16.1%), and Service Call (15.9%).
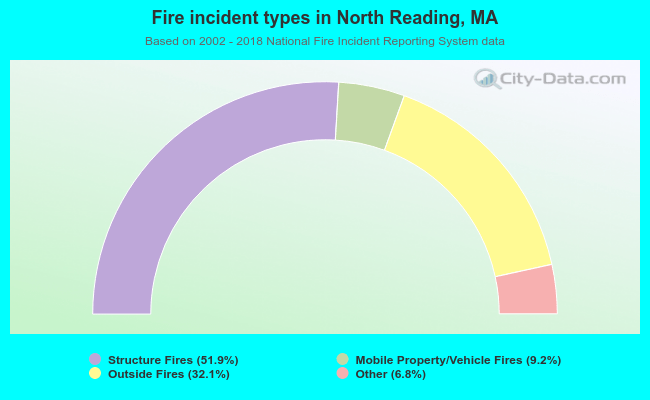 When looking into fire subcategories, the most incidents belonged to: Structure Fires (51.9%), and Outside Fires (32.1%).