Topsfield: Fire Incidents, Massachusetts (MA)
Where are fire incidents reported in Topsfield, MA
Something went wrong! Please refresh the page.
| Fire incidents reported | |
|---|---|
| Sreet name | Count |
| WASHINGTON ST | 528 |
| GREAT HILL DR | 414 |
| BOSTON ST | 282 |
| ROWLEY BRIDGE RD | 220 |
| NIKE VILLAGE | 188 |
| MAIN ST | 84 |
| WILDES RD | 78 |
| HIGH ST | 66 |
| CENTRAL ST | 60 |
| HAVERHILL RD | 52 |
| ASBURY ST | 48 |
| PERKINS ROW | 42 |
| IPSWICH RD | 34 |
| NORTH ST | 32 |
| RIVER RD | 30 |
| SOUTH MAIN ST | 30 |
| COPPERMINE RD | 28 |
| HILL ST | 28 |
| HOWLETT ST | 22 |
| ALDERBROOK DR | 20 |
| SALEM RD | 18 |
| WENHAM RD | 16 |
| PARSONAGE LN | 14 |
| CAMPMEETING RD | 12 |
| COLRAIN RD | 12 |
| CROSS ST | 12 |
| FAIRWAY DR | 12 |
| BARE HILL RD | 10 |
| CANDLEWOOD DR | 10 |
| E COMMON ST | 10 |
2002 - 2018 National Fire Incident Reporting System (NFIRS) incidents
- Incident types reported to NFIRS in Topsfield, MA
- 5,88545.5%Service Call
- 3,30125.5%Rescue & EMS
- 1,47311.4%Fire
- 9107.0%Hazardous Condition
- 8856.8%False Alarm
- 4563.5%Good Intent Call
- 130.1%Severe Weather
- Fire incident types reported to NFIRS in Topsfield, MA
- 1,14877.9%Structure Fires
- 24616.7%Outside Fires
- 614.1%Mobile Property/Vehicle Fires
- 181.2%Other
 Based on the data from the years 2002 - 2018 the average number of fires per year is 87. The highest number of reported fires - 118 took place in 2007, and the least - 53 in 2005. The data has an increasing trend.
 The median response time based on all reported fire incidents is 4 minutes. This is close to the state median value.
The median response time in Topsfield, MA compared to nearest cities:
(Note: Based on data for all years, including only cities with at least 500 fire incidents)
| Topsfield: | 4 minutes |
| Boxford: | 8 minutes |
| Middleton: | 4 minutes |
| Danvers: | 5 minutes |
| Hamilton: | 5 minutes |
| Georgetown: | 5 minutes |
| Ipswich: | 5 minutes |
| Beverly: | 4 minutes |
| Rowley: | 7 minutes |
 According to the data from the years 2002 - 2018 the average number of fire-related yearly casualties is 0. The highest number of reported injuries - 1 took place in 2002, and the lowest - 0 in 2003. The data has a constant trend.
The average number of casualties per 1,000 fires is 2. This indicator was the highest - 13 in 2009, and the lowest 0 in 2003. The trend for injuries per 1,000 fire incidents is declining. Compared to the Massachusetts value the number of casualties per 1,000 fire incidents is much lower.
According to the data from the years 2002 - 2018 the average number of fire-related yearly casualties is 0. The highest number of reported injuries - 1 took place in 2002, and the lowest - 0 in 2003. The data has a constant trend.
The average number of casualties per 1,000 fires is 2. This indicator was the highest - 13 in 2009, and the lowest 0 in 2003. The trend for injuries per 1,000 fire incidents is declining. Compared to the Massachusetts value the number of casualties per 1,000 fire incidents is much lower.
 28.4% incidents where reported in the morning and 71.6% in the evening. The most fires (16.2%) took place on Sunday, and the least (12.9%) on Thursday.
 Based on the 1,473 incident reports from years 2002 - 2018 most fires (10.1%) took place during May, and the least (6.4%) in February.
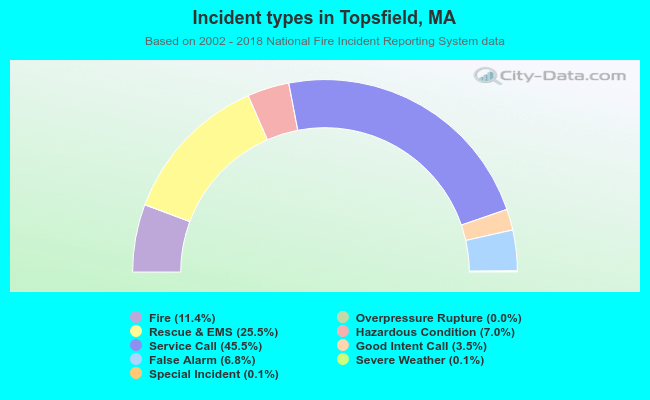 Out of all 12,937 cases reported during the years 2002 - 2018, the most belonged to the categories: Service Call (45.5%), Rescue & EMS (25.5%), and Fire (11.4%).
 When looking into fire subcategories, the most reports belonged to: Structure Fires (77.9%), and Outside Fires (16.7%).