Merced: Fire Incidents, California (CA)
Where are fire incidents reported in Merced, CA
Something went wrong! Please refresh the page.
| Fire incidents reported | |
|---|---|
| Sreet name | Count |
| 16TH ST | 300 |
| OLIVE AVE | 290 |
| G ST | 272 |
| MAIN ST | 242 |
| CHILDS AVE | 226 |
| R ST | 216 |
| LOUGHBOROUGH DR | 194 |
| HWY 59 | 170 |
| 18TH ST | 142 |
| 12TH ST | 138 |
| NORTH BEAR CREEK DR | 128 |
| HWY 99 | 120 |
| 23RD ST | 112 |
| 22ND ST | 108 |
| 11TH ST | 104 |
| M ST | 104 |
| 21ST ST | 96 |
| 59 HWY | 96 |
| 19TH ST | 94 |
| MARTIN LUTHER KING JR WAY | 92 |
| 25TH ST | 86 |
| PARSONS AVE | 86 |
| 99 HWY | 78 |
| 13TH ST | 76 |
| N ST | 72 |
| O ST | 68 |
| 8TH ST | 66 |
| GERARD AVE | 66 |
| 15TH ST | 64 |
| CANAL ST | 62 |
| Other | 547 |
2005 - 2018 National Fire Incident Reporting System (NFIRS) incidents
- Incident types reported to NFIRS in Merced, CA
- 22,14057.9%Rescue & EMS
- 6,07915.9%Good Intent Call
- 4,51511.8%Fire
- 2,3386.1%Service Call
- 1,5994.2%Hazardous Condition
- 1,4443.8%False Alarm
- 590.2%Special Incident
- 420.1%Overpressure Rupture
- Fire incident types reported to NFIRS in Merced, CA
- 2,73060.5%Outside Fires
- 1,16425.8%Structure Fires
- 54812.1%Mobile Property/Vehicle Fires
- 731.6%Other
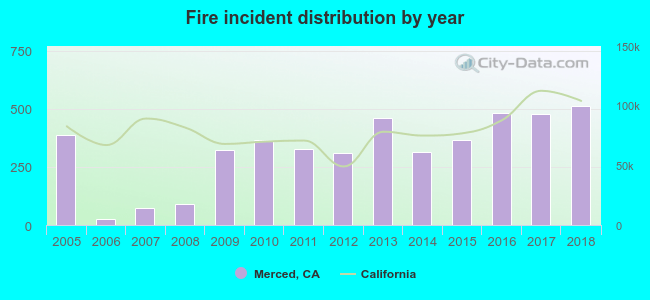 Based on the data from the years 2005 - 2018 the average number of fires per year is 322. The highest number of reported fires - 514 took place in 2018, and the least - 27 in 2006. The data has a rising trend.
The average number of yearly fire incidents per 10k residents in Merced, CA compared to nearest cities:
(Note: Based on data for the last 3 years, including only cities with population 5,000 and above)
| Merced: | 60.0 |
| Atwater: | 23.0 |
| Winton: | 48.1 |
| Livingston: | 21.0 |
| Chowchilla: | 85.3 |
| Delhi: | 81.2 |
| Dos Palos: | 7.2 |
| Turlock: | 16.4 |
| Los Banos: | 28.1 |
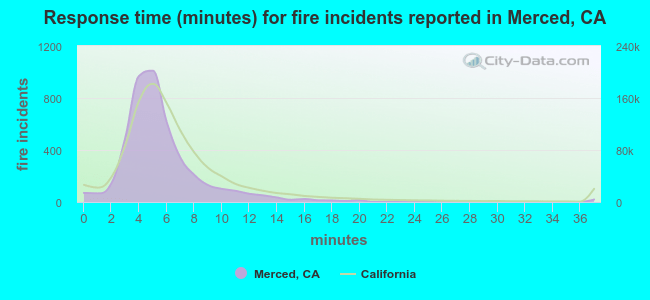 The median response time based on all reported fire incidents is 5 minutes. This is lower than the state median value.
The median response time in Merced, CA compared to nearest cities:
(Note: Based on data for all years, including only cities with at least 500 fire incidents)
| Merced: | 5 minutes |
| Atwater: | 9 minutes |
| Winton: | 6 minutes |
| Chowchilla: | 8 minutes |
| Delhi: | 7 minutes |
| Turlock: | 5 minutes |
| Los Banos: | 5 minutes |
| Mariposa: | 17 minutes |
| Madera: | 10 minutes |
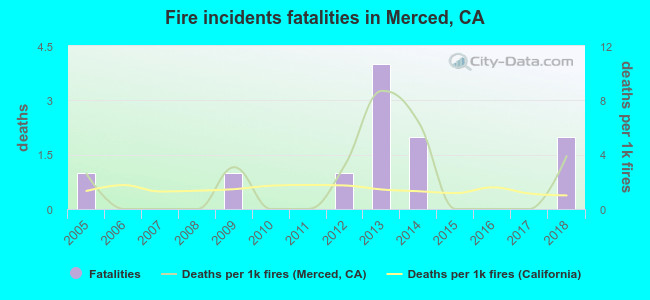 Based on the reports from the years 2005 - 2018 the average number of fire-related fatalities per year is 1. The highest number of deaths - 4 took place in 2013, and the lowest - 0 in 2006. The data has a rising trend.
The average number of fatalities per 1,000 fires is 2. This indicator was the highest - 9 in 2013, and the lowest 0 in 2006. The trend for fatalities per 1,000 fires is growing. Compared to the state value the number of deaths per 1,000 fires is higher.
Based on the reports from the years 2005 - 2018 the average number of fire-related fatalities per year is 1. The highest number of deaths - 4 took place in 2013, and the lowest - 0 in 2006. The data has a rising trend.
The average number of fatalities per 1,000 fires is 2. This indicator was the highest - 9 in 2013, and the lowest 0 in 2006. The trend for fatalities per 1,000 fires is growing. Compared to the state value the number of deaths per 1,000 fires is higher.
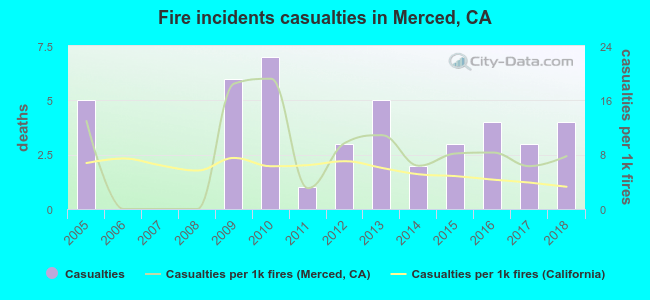 Based on the reports from the years 2005 - 2018 the average number of fire-related yearly casualties is 3. The highest number of casualties - 7 took place in 2010, and the lowest - 0 in 2006. The data has a declining trend.
The average number of casualties per 1,000 fire incidents is 8. This indicator was the highest - 19 in 2010, and the lowest 0 in 2006. The trend for casualties per 1,000 fires is declining. Compared to the state value the number of casualties per 1,000 fire incidents is higher.
Based on the reports from the years 2005 - 2018 the average number of fire-related yearly casualties is 3. The highest number of casualties - 7 took place in 2010, and the lowest - 0 in 2006. The data has a declining trend.
The average number of casualties per 1,000 fire incidents is 8. This indicator was the highest - 19 in 2010, and the lowest 0 in 2006. The trend for casualties per 1,000 fires is declining. Compared to the state value the number of casualties per 1,000 fire incidents is higher.
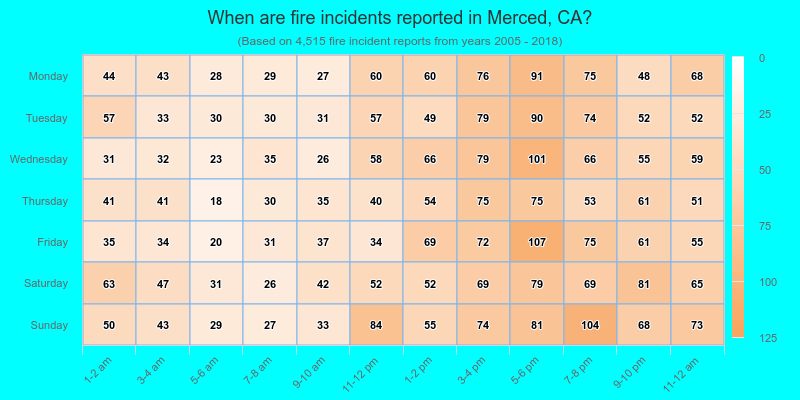
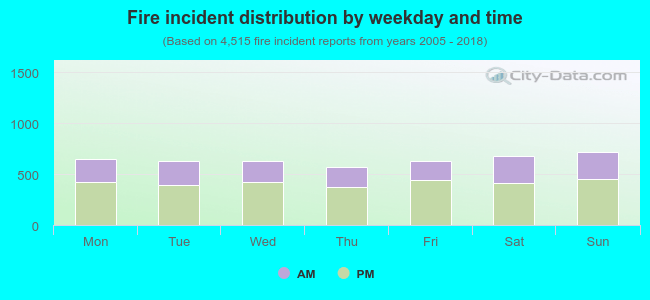 35.4% incidents where reported in the morning and 64.6% in the evening. The most fires (16.0%) took place on Sunday, and the least (12.7%) on Thursday.
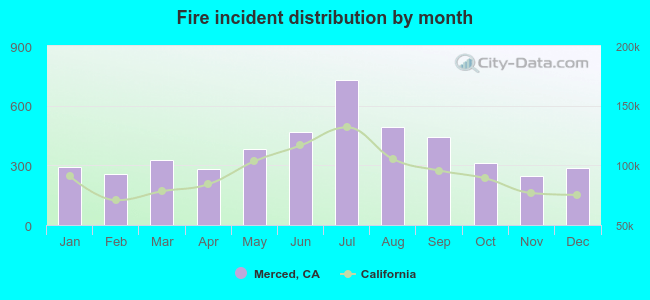 According to the 4,515 fires from years 2005 - 2018 most fires (16.1%) took place during July, and the least (5.5%) in November.
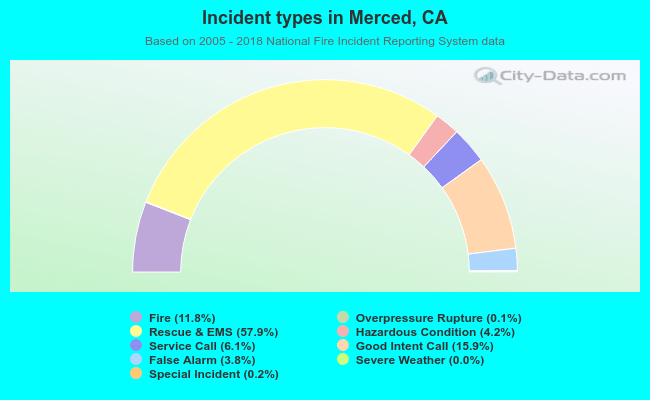 Out of all 38,219 cases reported during the years 2005 - 2018, the most belonged to the categories: Rescue & EMS (57.9%), Good Intent Call (15.9%), and Fire (11.8%).
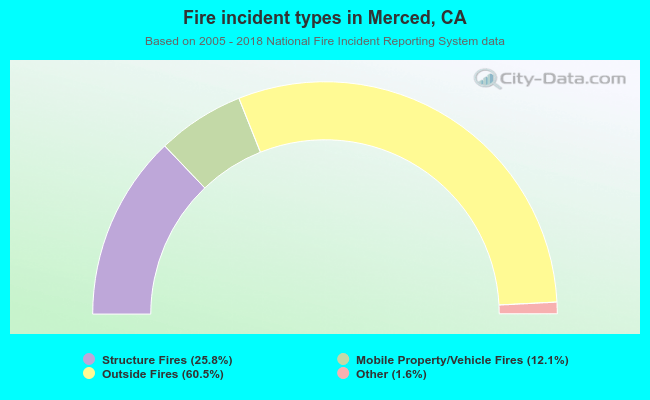 When looking into fire subcategories, the most incidents belonged to: Outside Fires (60.5%), and Structure Fires (25.8%).