Chowchilla: Fire Incidents, California (CA)
Where are fire incidents reported in Chowchilla, CA
Something went wrong! Please refresh the page.
|
| |||||||||||||||||||||||||||||||||||||||||||||||||||||||||||||||||||||||||||||||||||||||||||||||||||||||||||||
2005 - 2018 National Fire Incident Reporting System (NFIRS) incidents
- Incident types reported to NFIRS in Chowchilla, CA
- 1,07045.1%Fire
- 56123.6%Good Intent Call
- 32513.7%Rescue & EMS
- 1978.3%False Alarm
- 1466.1%Hazardous Condition
- 692.9%Service Call
- 30.1%Severe Weather
- 30.1%Special Incident
- Fire incident types reported to NFIRS in Chowchilla, CA
- 64960.7%Outside Fires
- 23722.1%Structure Fires
- 16815.7%Mobile Property/Vehicle Fires
- 161.5%Other
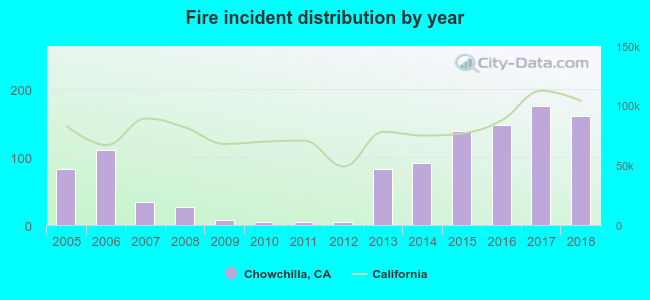 According to the data from the years 2005 - 2018 the average number of fire incidents per year is 76. The highest number of reported fire incidents - 176 took place in 2017, and the least - 4 in 2010. The data has a rising trend.
The average number of yearly fire incidents per 10k residents in Chowchilla, CA compared to nearest cities:
(Note: Based on data for the last 3 years, including only cities with population 5,000 and above)
| Chowchilla: | 85.3 |
| Madera Acres: | 1.8 |
| Madera: | 19.3 |
| Merced: | 60.0 |
| Firebaugh: | 42.6 |
| Dos Palos: | 7.2 |
| Atwater: | 23.0 |
| Mendota: | 109.2 |
| Winton: | 48.1 |
 The median response time based on all reported fire incidents is 8 minutes. This is higher than the state median value.
The median response time in Chowchilla, CA compared to nearest cities:
(Note: Based on data for all years, including only cities with at least 500 fire incidents)
| Chowchilla: | 8 minutes |
| Madera: | 10 minutes |
| Merced: | 5 minutes |
| Atwater: | 9 minutes |
| Mendota: | 11 minutes |
| Winton: | 6 minutes |
| Kerman: | 9 minutes |
| Mariposa: | 17 minutes |
| Los Banos: | 5 minutes |
 26.8% incidents where reported in the morning and 73.2% in the evening. The most fires (15.5%) took place on Monday, and the least (13.1%) on Friday.
 According to the 1,070 fire incidents from years 2005 - 2018 most fires (16.8%) took place during July, and the least (3.2%) in February.
 Out of all 2,374 cases reported during the years 2005 - 2018, the most belonged to the categories: Fire (45.1%), Service Call (23.6%), and Overpressure Rupture (13.7%).
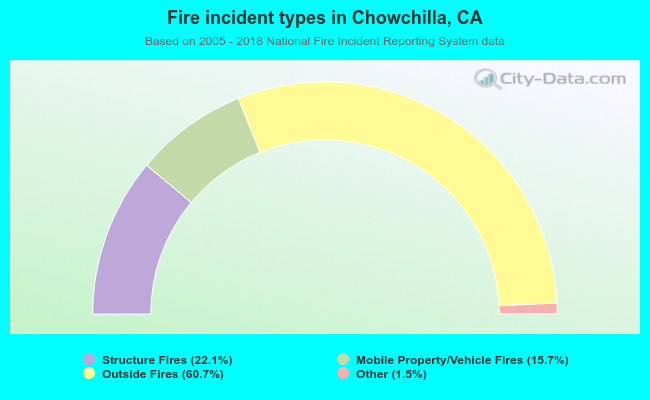 When looking into fire subcategories, the most reports belonged to: Outside Fires (60.7%), and Structure Fires (22.1%).