Delhi: Fire Incidents, California (CA)
Where are fire incidents reported in Delhi, CA
Something went wrong! Please refresh the page.
|
| |||||||||||||||||||||||||||||||||||||||||||||||||||||||||||||||||||||||||||||||||||||||||||||||||||||||||||||
2006 - 2018 National Fire Incident Reporting System (NFIRS) incidents
- Incident types reported to NFIRS in Delhi, CA
- 2,19651.5%Rescue & EMS
- 81919.2%Fire
- 58413.7%Good Intent Call
- 2816.6%Service Call
- 2576.0%False Alarm
- 1182.8%Hazardous Condition
- Fire incident types reported to NFIRS in Delhi, CA
- 46056.2%Outside Fires
- 18222.2%Mobile Property/Vehicle Fires
- 13816.8%Structure Fires
- 394.8%Other
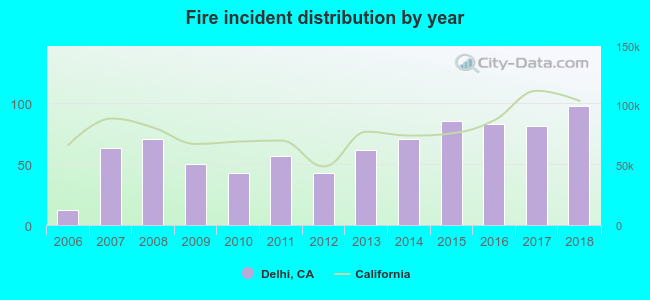 Based on the data from the years 2006 - 2018 the average number of fires per year is 63. The highest number of reported fire incidents - 98 took place in 2018, and the least - 12 in 2006. The data has an increasing trend.
The average number of yearly fire incidents per 10k residents in Delhi, CA compared to nearest cities:
(Note: Based on data for the last 3 years, including only cities with population 5,000 and above)
| Delhi: | 81.2 |
| Livingston: | 21.0 |
| Turlock: | 16.4 |
| Winton: | 48.1 |
| Atwater: | 23.0 |
| Keyes: | 22.3 |
| Hughson: | 25.4 |
| Waterford: | 54.2 |
| Ceres: | 36.3 |
 The median response time based on all reported fire incidents is 7 minutes. This is comparable to the California median value.
The median response time in Delhi, CA compared to nearest cities:
(Note: Based on data for all years, including only cities with at least 500 fire incidents)
| Delhi: | 7 minutes |
| Turlock: | 5 minutes |
| Winton: | 6 minutes |
| Atwater: | 9 minutes |
| Ceres: | 5 minutes |
| Merced: | 5 minutes |
| Patterson: | 5 minutes |
| Modesto: | 5 minutes |
| Riverbank: | 6 minutes |
 39.9% incidents where reported in the morning and 60.1% in the evening. The most fires (16.7%) took place on Saturday, and the least (12.8%) on Friday.
 According to the 819 fires from years 2006 - 2018 most fires (13.3%) took place during May, and the least (5.0%) in March.
 Out of all 4,262 cases reported during the years 2006 - 2018, the most belonged to the categories: Rescue & EMS (51.5%), Fire (19.2%), and Good Intent Call (13.7%).
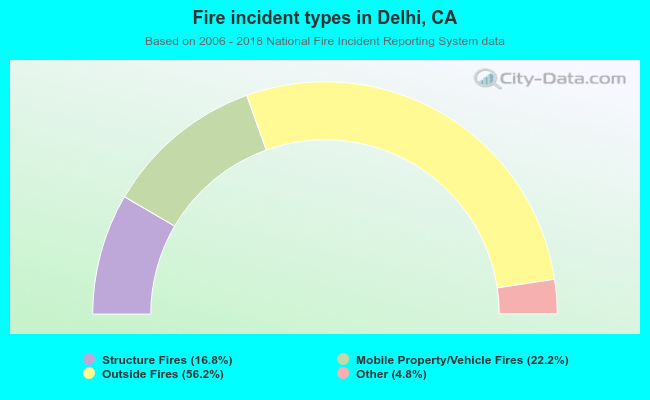 When looking into fire subcategories, the most incidents belonged to: Outside Fires (56.2%), and Mobile Property/Vehicle Fires (22.2%).