Ceres: Fire Incidents, California (CA)
Where are fire incidents reported in Ceres, CA
Something went wrong! Please refresh the page.
| Fire incidents reported | |
|---|---|
| Sreet name | Count |
| MITCHELL RD | 204 |
| HATCH RD | 184 |
| CENTRAL AVE | 164 |
| WHITMORE AVE | 136 |
| RICHLAND AVE | 114 |
| EVANS RD | 104 |
| SERVICE RD | 102 |
| HERNDON RD | 64 |
| RIVER RD | 62 |
| HACKETT RD | 58 |
| BLAKER RD | 56 |
| HWY 99 | 56 |
| WALNUT AVE | 52 |
| 99 HWY | 50 |
| MORGAN RD | 50 |
| FOWLER RD | 48 |
| DON PEDRO RD | 44 |
| COLLINS RD | 36 |
| CROWS LANDING RD | 36 |
| 9TH ST | 34 |
| ROEDING RD | 30 |
| MOFFETT RD | 28 |
| RICHARD WAY | 28 |
| DARRAH ST | 24 |
| KINSER RD | 22 |
| EL CAMINO | 20 |
| FOURTH ST | 20 |
| MOORE RD | 20 |
| NINTH ST | 20 |
| FIFTH ST | 18 |
2005 - 2018 National Fire Incident Reporting System (NFIRS) incidents
- Incident types reported to NFIRS in Ceres, CA
- 7,60259.8%Rescue & EMS
- 1,85414.6%Fire
- 1,43211.3%Good Intent Call
- 7225.7%Service Call
- 6415.0%Hazardous Condition
- 4473.5%False Alarm
- 210.2%Special Incident
- Fire incident types reported to NFIRS in Ceres, CA
- 74640.2%Outside Fires
- 71538.6%Structure Fires
- 29415.9%Mobile Property/Vehicle Fires
- 995.3%Other
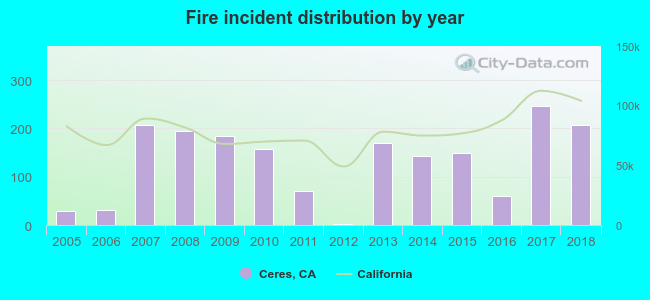 According to the data from the years 2005 - 2018 the average number of fire incidents per year is 132. The highest number of fire incidents - 247 took place in 2017, and the least - 2 in 2012. The data has a growing trend.
The average number of yearly fire incidents per 10k residents in Ceres, CA compared to nearest cities:
(Note: Based on data for the last 3 years, including only cities with population 5,000 and above)
| Ceres: | 36.3 |
| Keyes: | 22.3 |
| Modesto: | 68.9 |
| Hughson: | 25.4 |
| Turlock: | 16.4 |
| Riverbank: | 32.8 |
| Salida: | 6.6 |
| Waterford: | 54.2 |
| Oakdale: | 39.2 |
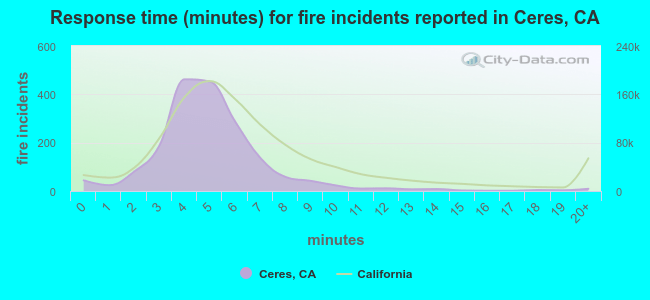 The median response time based on all reported fire incidents is 5 minutes. This is lower compared to the California median value.
The median response time in Ceres, CA compared to nearest cities:
(Note: Based on data for all years, including only cities with at least 500 fire incidents)
| Ceres: | 5 minutes |
| Modesto: | 5 minutes |
| Turlock: | 5 minutes |
| Riverbank: | 6 minutes |
| Oakdale: | 6 minutes |
| Patterson: | 5 minutes |
| Ripon: | 6 minutes |
| Delhi: | 7 minutes |
| Manteca: | 5 minutes |
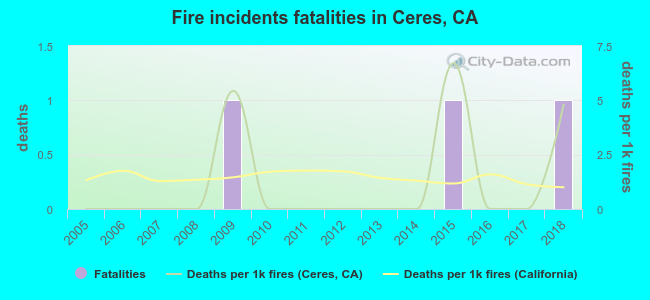 According to the reports from the years 2005 - 2018 the average number of fire-related yearly deaths is 0. The highest number of reported deaths - 1 took place in 2009, and the lowest - 0 in 2005. The data has a growing trend.
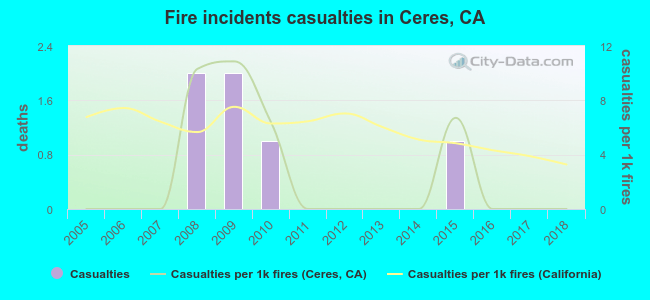 According to the reports from the years 2005 - 2018 the average number of fire-related yearly casualties is 0. The highest number of reported casualties - 2 took place in 2008, and the lowest - 0 in 2005. The data has a constant trend.
The average number of casualties per 1,000 fires is 2. This indicator was the highest - 11 in 2009, and the lowest 0 in 2005. The trend for injuries per 1,000 fires is constant. Compared to the state value the number of injuries per 1,000 incidents is lower.
According to the reports from the years 2005 - 2018 the average number of fire-related yearly casualties is 0. The highest number of reported casualties - 2 took place in 2008, and the lowest - 0 in 2005. The data has a constant trend.
The average number of casualties per 1,000 fires is 2. This indicator was the highest - 11 in 2009, and the lowest 0 in 2005. The trend for injuries per 1,000 fires is constant. Compared to the state value the number of injuries per 1,000 incidents is lower.
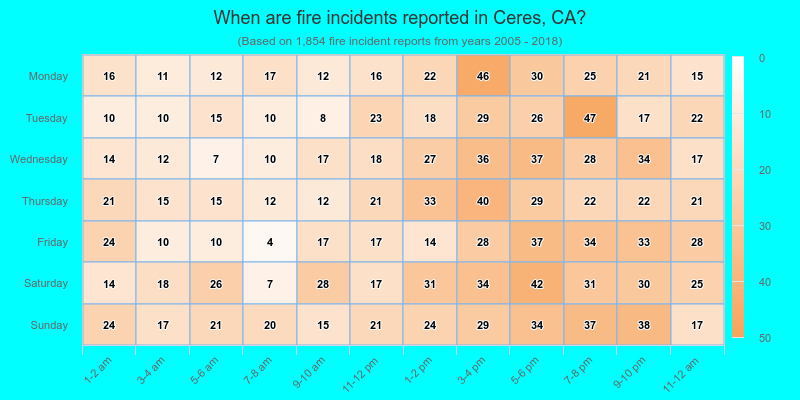
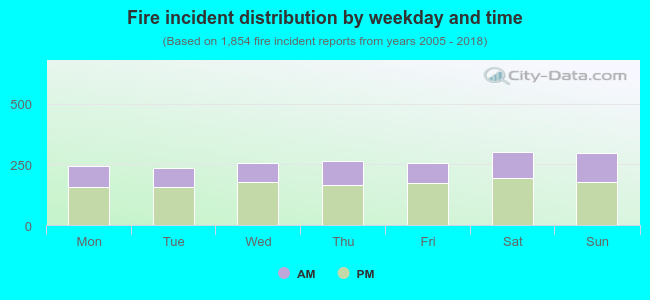 34.7% incidents where reported in the morning and 65.3% in the evening. The most fires (16.3%) took place on Saturday, and the least (12.7%) on Tuesday.
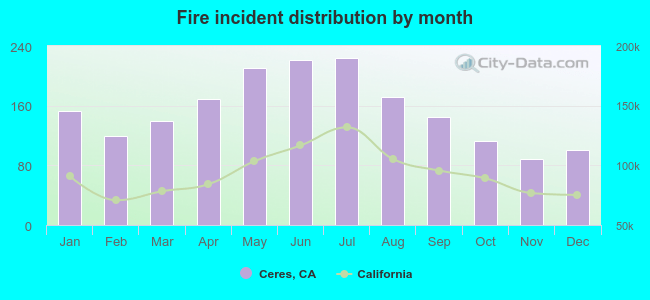 Based on the 1,854 fires from years 2005 - 2018 most fires (12.1%) took place during July, and the least (4.8%) in November.
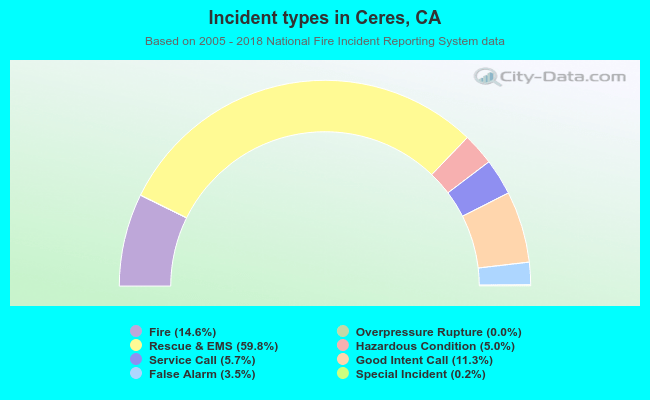 Out of all 12,721 cases reported during the years 2005 - 2018, the most belonged to the categories: Rescue & EMS (59.8%), Fire (14.6%), and Good Intent Call (11.3%).
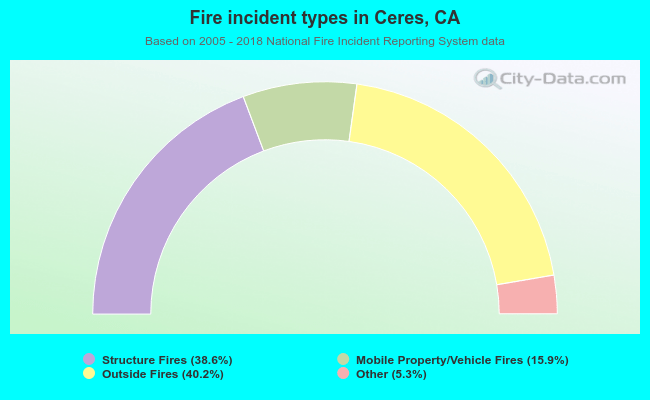 When looking into fire subcategories, the most reports belonged to: Outside Fires (40.2%), and Structure Fires (38.6%).