London: Fire Incidents, Ohio (OH)
Where are fire incidents reported in London, OH
Something went wrong! Please refresh the page.
| Fire incidents reported | |
|---|---|
| Sreet name | Count |
| HIGH ST | 184 |
| MAIN ST | 132 |
| LAFAYETTE ST | 124 |
| ST RT 56 | 78 |
| OAK ST | 72 |
| ELM ST | 70 |
| STATE ROUTE 56 HWY | 54 |
| HIGH | 50 |
| FIRST ST | 48 |
| MADISON RD | 48 |
| CENTER ST | 46 |
| WALNUT ST | 46 |
| STATE ROUTE 38 HWY | 44 |
| GLADE RUN RD | 42 |
| SHEFFIELD BLVD | 38 |
| ARBUCKLE RD | 34 |
| CHOCTAW DR | 34 |
| INTERSTATE 70 | 34 |
| OLD XENIA RD | 32 |
| SPRING VALLEY RD | 32 |
| MAPLE ST | 28 |
| ROBERTS MILL RD | 28 |
| ST RT 38 | 28 |
| SURREY LN | 28 |
| SURREY LN | 28 |
| U S 42 HWY | 28 |
| LINCOLN AVE | 26 |
| I R 70 FWY | 22 |
| LAFAYETTE PLAIN CITY RD | 22 |
| MADISON | 22 |
| Other | 681 |
2002 - 2018 National Fire Incident Reporting System (NFIRS) incidents
- Incident types reported to NFIRS in London, OH
- 2,21525.8%Rescue & EMS
- 2,18325.4%Fire
- 1,66219.4%Hazardous Condition
- 1,40416.3%Good Intent Call
- 6517.6%Service Call
- 4285.0%False Alarm
- 290.3%Overpressure Rupture
- 120.1%Special Incident
- Fire incident types reported to NFIRS in London, OH
- 1,08649.7%Structure Fires
- 73533.7%Outside Fires
- 32715.0%Mobile Property/Vehicle Fires
- 351.6%Other
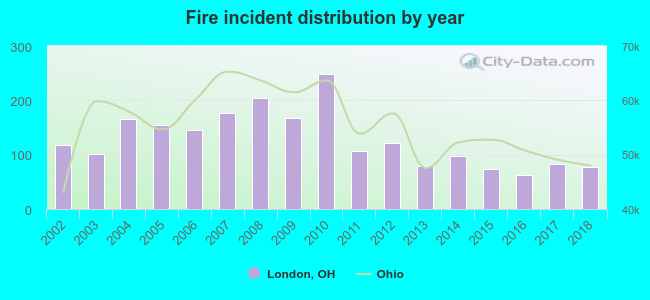 According to the data from the years 2002 - 2018 the average number of fires per year is 128. The highest number of fire incidents - 249 took place in 2010, and the least - 63 in 2016. The data has a dropping trend.
The average number of yearly fire incidents per 10k residents in London, OH compared to nearest cities:
(Note: Based on data for the last 3 years, including only cities with population 5,000 and above)
| London: | 73.6 |
| Hilliard: | 26.7 |
| Springfield: | 71.8 |
| Grove City: | 17.6 |
| Upper Arlington: | 17.7 |
| Dublin: | 22.9 |
| Grandview Heights: | 16.1 |
| Urbana: | 68.3 |
| Marysville: | 39.6 |
 The median response time based on all reported fire incidents is 8 minutes. This is higher than the Ohio median value.
The median response time in London, OH compared to nearest cities:
(Note: Based on data for all years, including only cities with at least 500 fire incidents)
| London: | 8 minutes |
| West Jefferson: | 8 minutes |
| South Charleston: | 14 minutes |
| Mechanicsburg: | 9 minutes |
| Jeffersonville: | 11 minutes |
| Plain City: | 8 minutes |
| Hilliard: | 6 minutes |
| Springfield: | 6 minutes |
| Grove City: | 5 minutes |
 Based on the reports from the years 2002 - 2018 the average number of fire-related fatalities per year is 0. The highest number of reported deaths - 3 took place in 2008, and the lowest - 0 in 2002. The data has a constant trend.
 According to the reports from the years 2002 - 2018 the average number of fire-related casualties per year is 1. The highest number of reported injuries - 3 took place in 2014, and the lowest - 0 in 2002. The data has a constant trend.
The average number of casualties per 1,000 fire incidents is 4. This indicator was the highest - 31 in 2014, and the lowest 0 in 2002. The trend for casualties per 1,000 fire incidents is decreasing. Compared to the state value the number of casualties per 1,000 incidents is much lower.
According to the reports from the years 2002 - 2018 the average number of fire-related casualties per year is 1. The highest number of reported injuries - 3 took place in 2014, and the lowest - 0 in 2002. The data has a constant trend.
The average number of casualties per 1,000 fire incidents is 4. This indicator was the highest - 31 in 2014, and the lowest 0 in 2002. The trend for casualties per 1,000 fire incidents is decreasing. Compared to the state value the number of casualties per 1,000 incidents is much lower.Casualties per 1,000 incidents in London, OH compared to nearest cities:
(Note: Based on data for all years, including only cities with at least 500 fire incidents)
| London: | 5.0 |
| West Jefferson: | 9.7 |
| South Charleston: | 1.8 |
| Mechanicsburg: | 9.5 |
| Jeffersonville: | 0.0 |
| Plain City: | 5.5 |
| Hilliard: | 12.7 |
| Springfield: | 18.9 |
| Grove City: | 14.1 |
 29.8% incidents where reported in the morning and 70.2% in the evening. The most fires (16.1%) took place on Friday, and the least (12.0%) on Thursday.
 According to the 2,183 reports from years 2002 - 2018 most fires (10.6%) took place during April, and the least (6.2%) in August.
 Out of all 8,588 cases reported during the years 2002 - 2018, the most belonged to the categories: Rescue & EMS (25.8%), Fire (25.4%), and Hazardous Condition (19.4%).
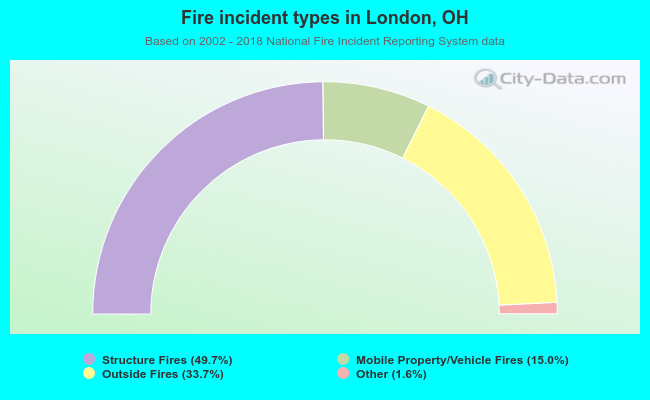 When looking into fire subcategories, the most incidents belonged to: Structure Fires (49.7%), and Outside Fires (33.7%).