Dublin: Fire Incidents, Ohio (OH)
Where are fire incidents reported in Dublin, OH
Something went wrong! Please refresh the page.
| Fire incidents reported | |
|---|---|
| Sreet name | Count |
| EMERALD PKY | 146 |
| RIVERSIDE DR | 104 |
| SAWMILL RD | 104 |
| METRO PL | 98 |
| FRANTZ RD | 84 |
| RINGS RD | 84 |
| 270 | 82 |
| DUBLIN RD | 74 |
| AVERY RD | 66 |
| POST RD | 64 |
| PERIMETER DR | 58 |
| BRIDGE ST | 56 |
| HOSPITAL DR | 42 |
| I-270 | 42 |
| MUIRFIELD DR | 40 |
| TUTTLE CROSSING BLVD | 40 |
| HIGH ST | 38 |
| PERIMETER LOOP RD | 38 |
| COFFMAN RD | 34 |
| EITERMAN RD | 34 |
| HOUCHARD RD | 34 |
| SR 33 | 34 |
| BLAZER PKY | 32 |
| COSGRAY RD | 32 |
| TARTAN FIELDS DR | 32 |
| TULLER RD | 30 |
| DUBLIN-GRANVILLE RD | 28 |
| TULLYMORE DR | 28 |
| 33 | 26 |
| DUBLIN CENTER DR | 26 |
| Other | 439 |
2002 - 2018 National Fire Incident Reporting System (NFIRS) incidents
- Incident types reported to NFIRS in Dublin, OH
- 16,45958.8%Rescue & EMS
- 3,61812.9%False Alarm
- 2,2728.1%Good Intent Call
- 2,2137.9%Hazardous Condition
- 2,0697.4%Fire
- 1,2054.3%Service Call
- 1100.4%Overpressure Rupture
- 400.1%Severe Weather
- Fire incident types reported to NFIRS in Dublin, OH
- 91744.3%Outside Fires
- 81139.2%Structure Fires
- 28914.0%Mobile Property/Vehicle Fires
- 522.5%Other
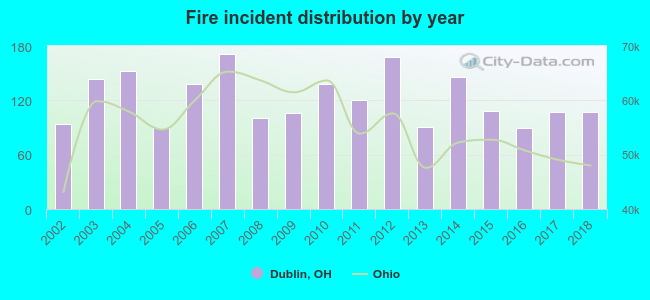 Based on the data from the years 2002 - 2018 the average number of fires per year is 122. The highest number of fires - 171 took place in 2007, and the least - 89 in 2005. The data has a rising trend.
The average number of yearly fire incidents per 10k residents in Dublin, OH compared to nearest cities:
(Note: Based on data for the last 3 years, including only cities with population 5,000 and above)
| Dublin: | 22.9 |
| Powell: | 33.0 |
| Hilliard: | 26.7 |
| Worthington: | 24.6 |
| Upper Arlington: | 17.7 |
| Grandview Heights: | 16.1 |
| Columbus: | 38.2 |
| Westerville: | 14.8 |
| Delaware: | 54.3 |
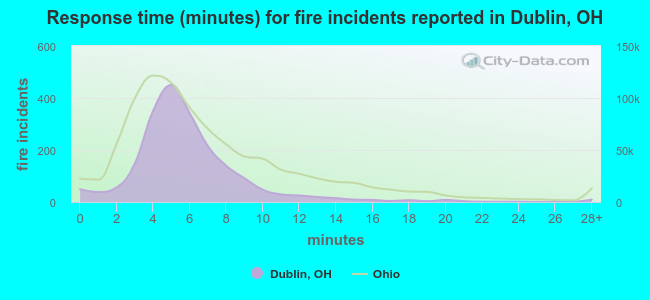 The median response time based on all reported fire incidents is 5 minutes. This is lower than the Ohio median value.
The median response time in Dublin, OH compared to nearest cities:
(Note: Based on data for all years, including only cities with at least 500 fire incidents)
| Dublin: | 5 minutes |
| Powell: | 6 minutes |
| Hilliard: | 6 minutes |
| Worthington: | 4 minutes |
| Plain City: | 8 minutes |
| Upper Arlington: | 5 minutes |
| Columbus: | 4 minutes |
| Westerville: | 6 minutes |
| West Jefferson: | 8 minutes |
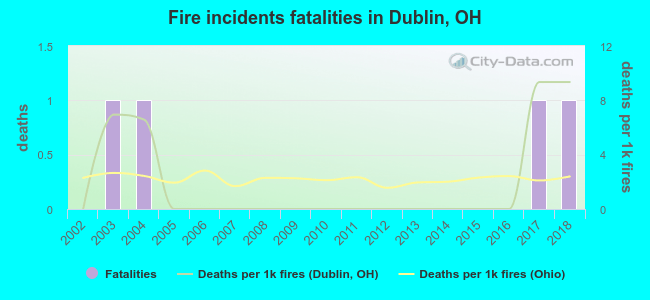 Based on the data from the years 2002 - 2018 the average number of fire-related yearly deaths is 0. The highest number of reported deaths - 1 took place in 2003, and the lowest - 0 in 2002. The data has a rising trend.
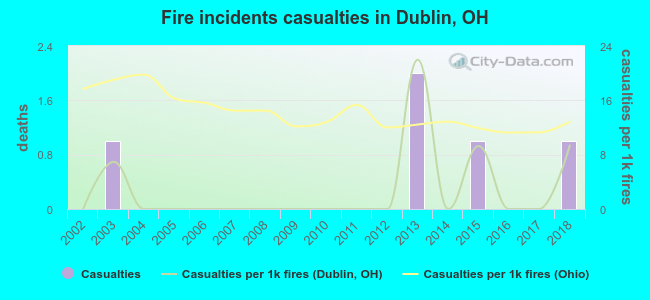 Based on the reports from the years 2002 - 2018 the average number of fire-related casualties per year is 0. The highest number of injuries - 2 took place in 2013, and the lowest - 0 in 2002. The data has an increasing trend.
The average number of injuries per 1,000 fires is 3. This indicator was the highest - 22 in 2013, and the lowest 0 in 2002. The trend for casualties per 1,000 fires is rising. Compared to the state value the number of injuries per 1,000 fire incidents is much lower.
Based on the reports from the years 2002 - 2018 the average number of fire-related casualties per year is 0. The highest number of injuries - 2 took place in 2013, and the lowest - 0 in 2002. The data has an increasing trend.
The average number of injuries per 1,000 fires is 3. This indicator was the highest - 22 in 2013, and the lowest 0 in 2002. The trend for casualties per 1,000 fires is rising. Compared to the state value the number of injuries per 1,000 fire incidents is much lower.Casualties per 1,000 incidents in Dublin, OH compared to nearest cities:
(Note: Based on data for all years, including only cities with at least 500 fire incidents)
| Dublin: | 2.4 |
| Powell: | 11.1 |
| Hilliard: | 12.7 |
| Worthington: | 10.2 |
| Plain City: | 5.5 |
| Upper Arlington: | 15.7 |
| Columbus: | 13.4 |
| Westerville: | 15.6 |
| West Jefferson: | 9.7 |
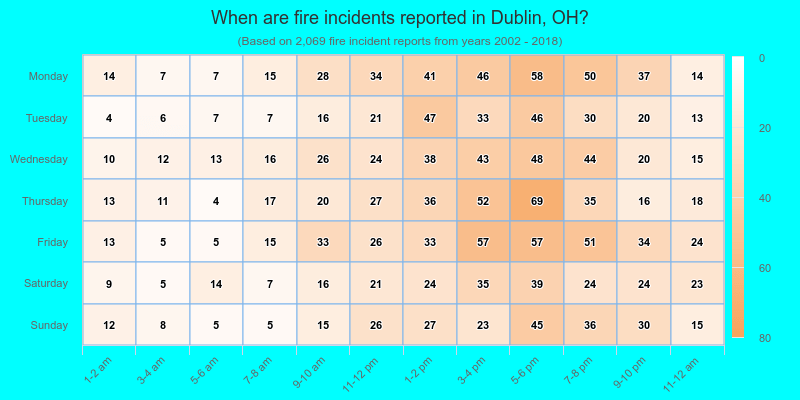
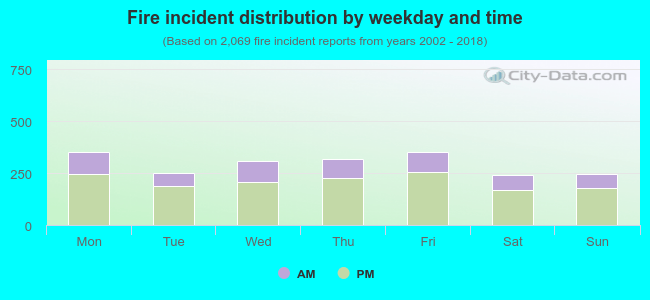 29.0% incidents where reported in the morning and 71.0% in the evening. The most fires (17.1%) took place on Friday, and the least (11.6%) on Saturday.
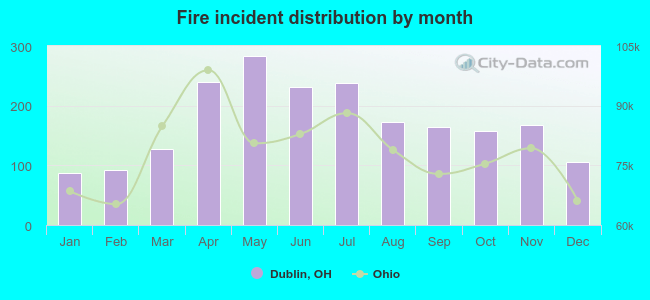 According to the 2,069 reports from years 2002 - 2018 most fires (13.7%) took place during May, and the least (4.2%) in January.
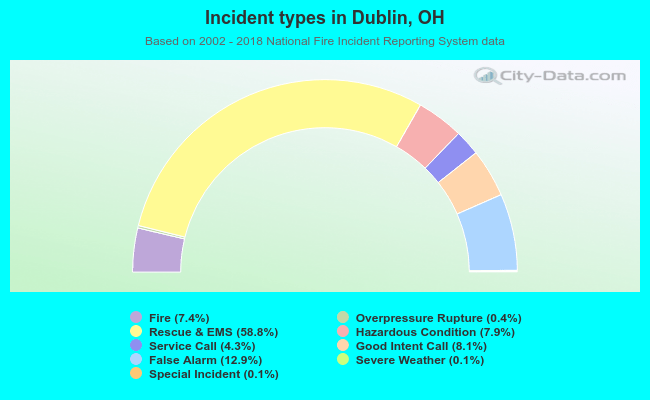 Out of all 28,013 cases reported during the years 2002 - 2018, the most belonged to the categories: Rescue & EMS (58.8%), False Alarm (12.9%), and Good Intent Call (8.1%).
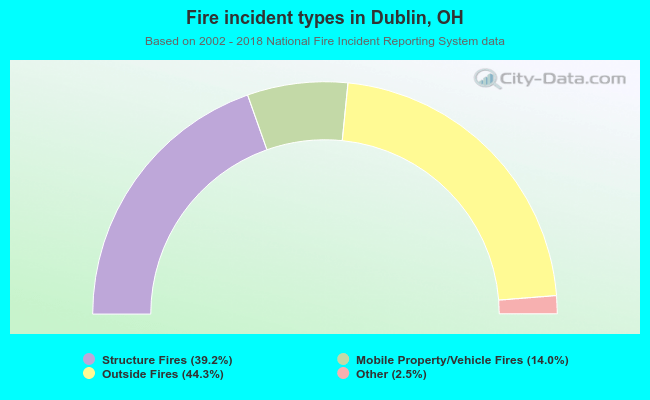 When looking into fire subcategories, the most reports belonged to: Outside Fires (44.3%), and Structure Fires (39.2%).