Grandview Heights: Fire Incidents, Ohio (OH)
Where are fire incidents reported in Grandview Heights, OH
Something went wrong! Please refresh the page.
|
| |||||||||||||||||||||||||||||||||||||||||||||||||||||||||||||||||||||||||||||||||||||||||||||||||||||||||||||
2002 - 2018 National Fire Incident Reporting System (NFIRS) incidents
- Incident types reported to NFIRS in Grandview Heights, OH
- 73435.0%Rescue & EMS
- 46222.0%Hazardous Condition
- 31114.8%Fire
- 27613.2%False Alarm
- 1999.5%Good Intent Call
- 1055.0%Service Call
- 70.3%Overpressure Rupture
- Fire incident types reported to NFIRS in Grandview Heights, OH
- 19462.4%Structure Fires
- 9129.3%Outside Fires
- 237.4%Mobile Property/Vehicle Fires
- 31.0%Other
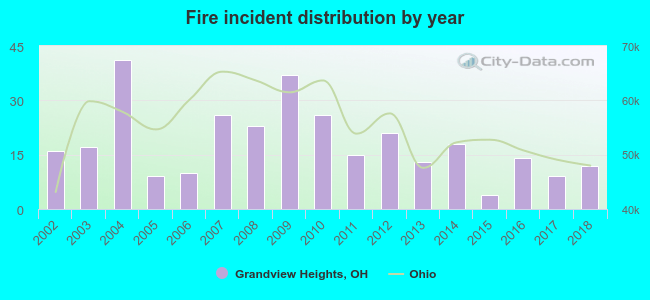 According to the data from the years 2002 - 2018 the average number of fire incidents per year is 18. The highest number of fire incidents - 41 took place in 2004, and the least - 4 in 2015. The data has a declining trend.
The average number of yearly fire incidents per 10k residents in Grandview Heights, OH compared to nearest cities:
(Note: Based on data for the last 3 years, including only cities with population 5,000 and above)
| Grandview Heights: | 16.1 |
| Columbus: | 38.2 |
| Upper Arlington: | 17.7 |
| Bexley: | 9.6 |
| Hilliard: | 26.7 |
| Grove City: | 17.6 |
| Worthington: | 24.6 |
| Whitehall: | 50.3 |
| Gahanna: | 20.2 |

 Based on the reports from the years 2002 - 2018 the average number of fire-related yearly casualties is 0. The highest number of casualties - 2 took place in 2004, and the lowest - 0 in 2002. The data has a constant trend.
 29.3% incidents where reported in the morning and 70.7% in the evening. The most fires (16.7%) took place on Monday, and the least (12.5%) on Tuesday.
 Based on the 311 incident reports from years 2002 - 2018 most fires (11.6%) took place during May, and the least (5.5%) in March.
 Out of all 2,096 cases reported during the years 2002 - 2018, the most belonged to the categories: Rescue & EMS (35.0%), Hazardous Condition (22.0%), and Fire (14.8%).
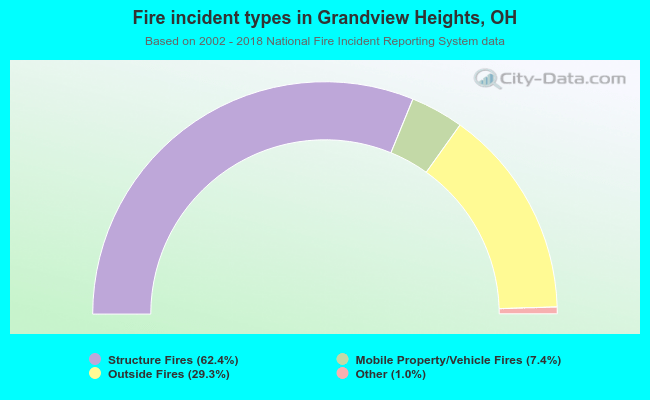 When looking into fire subcategories, the most incidents belonged to: Structure Fires (62.4%), and Outside Fires (29.3%).