Jefferson City: Fire Incidents, Missouri (MO)
Where are fire incidents reported in Jefferson City, MO
Something went wrong! Please refresh the page.
| Fire incidents reported | |
|---|---|
| Sreet name | Count |
| MCCARTY ST | 82 |
| HIGH ST | 74 |
| JACKSON ST | 56 |
| JEFFERSON ST | 48 |
| MAIN ST | 46 |
| MILLER ST | 40 |
| TEN MILE DR | 38 |
| MISSOURI BLVD | 34 |
| MISSOURI BLV | 32 |
| DUNKLIN ST | 30 |
| ELLIS BLVD | 30 |
| COUNTRY CLUB DR | 28 |
| ELM ST | 28 |
| HIGHWAY 54 | 26 |
| SOUTHRIDGE DR | 26 |
| SOUTHWEST BLVD | 26 |
| MONROE ST | 24 |
| W. BUS. 50 | 24 |
| HWY 179 | 22 |
| HWY 50 63 | 22 |
| TRUMAN BLVD | 22 |
| VENTURA AVE | 22 |
| ADAMS ST | 20 |
| BOONVILLE RD | 20 |
| CLARK AVE | 18 |
| EDMONDS ST | 18 |
| ASHLEY ST | 16 |
| ATCHISON ST | 16 |
| CASE AVE | 16 |
| CHERRY ST | 16 |
| Other | 608 |
2002 - 2018 National Fire Incident Reporting System (NFIRS) incidents
- Incident types reported to NFIRS in Jefferson City, MO
- 11,01858.1%Rescue & EMS
- 1,91310.1%False Alarm
- 1,5908.4%Hazardous Condition
- 1,5288.1%Fire
- 1,5017.9%Service Call
- 1,3537.1%Good Intent Call
- 470.2%Special Incident
- 210.1%Overpressure Rupture
- Fire incident types reported to NFIRS in Jefferson City, MO
- 68044.5%Outside Fires
- 52234.2%Structure Fires
- 23815.6%Mobile Property/Vehicle Fires
- 885.8%Other
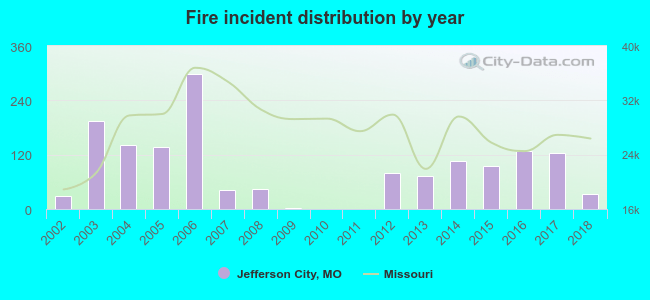 Based on the data from the years 2002 - 2018 the average number of fires per year is 90. The highest number of reported fires - 298 took place in 2006, and the least - 0 in 2010. The data has a rising trend.
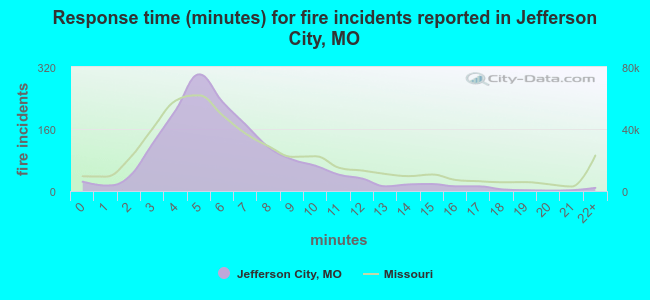 The median response time based on all reported fire incidents is 6 minutes. This is close to the state median value.
The median response time in Jefferson City, MO compared to nearest cities:
(Note: Based on data for all years, including only cities with at least 500 fire incidents)
| Jefferson City: | 6 minutes |
| Holts Summit: | 9 minutes |
| California: | 7 minutes |
| Fulton: | 5 minutes |
| Eldon: | 7 minutes |
| Columbia: | 5 minutes |
| Lake Ozark: | 8 minutes |
| Versailles: | 9 minutes |
| Osage Beach: | 7 minutes |
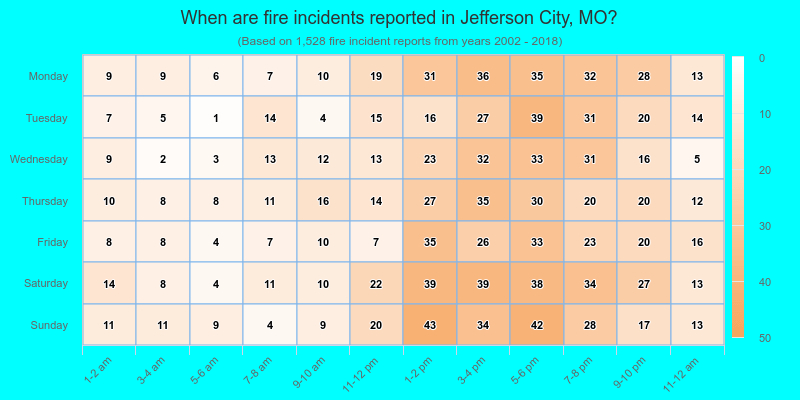
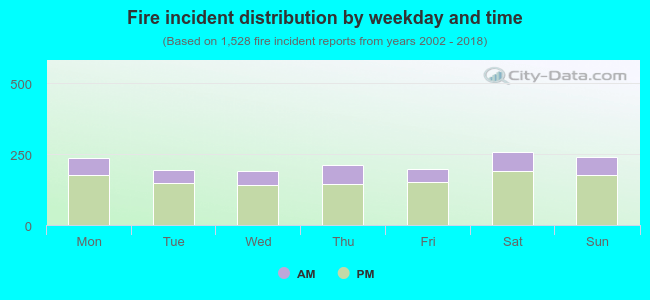 26.3% incidents where reported in the morning and 73.7% in the evening. The most fires (17.0%) took place on Saturday, and the least (12.6%) on Wednesday.
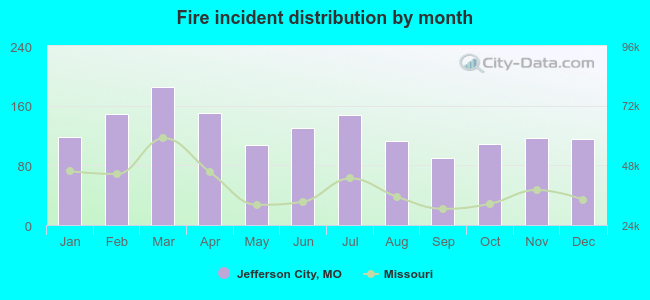 Based on the 1,528 reports from years 2002 - 2018 most fires (12.1%) took place during March, and the least (5.9%) in September.
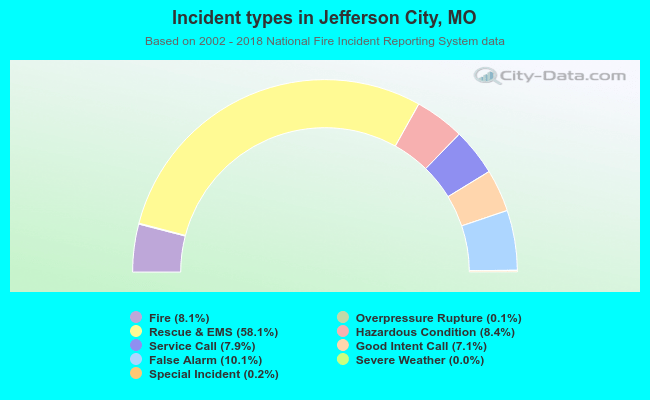 Out of all 18,974 cases reported during the years 2002 - 2018, the most belonged to the categories: Rescue & EMS (58.1%), False Alarm (10.1%), and Hazardous Condition (8.4%).
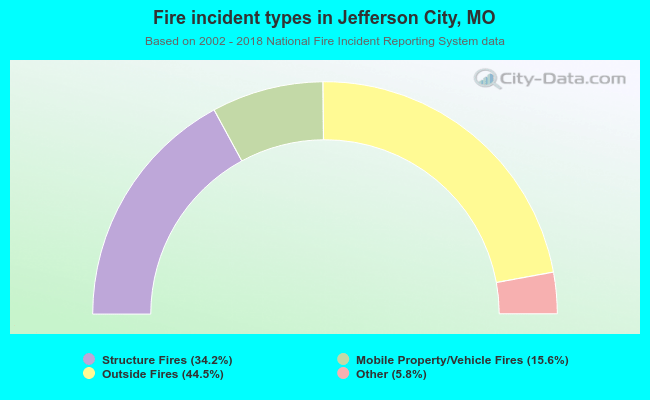 When looking into fire subcategories, the most reports belonged to: Outside Fires (44.5%), and Structure Fires (34.2%).