Columbia: Fire Incidents, Missouri (MO)
Where are fire incidents reported in Columbia, MO
Something went wrong! Please refresh the page.
| Fire incidents reported | |
|---|---|
| Sreet name | Count |
| PROVIDENCE RD | 200 |
| BUSINESS LOOP 70 | 166 |
| I70 E | 146 |
| STADIUM BLVD | 142 |
| BROADWAY W | 122 |
| NIFONG BLVD | 120 |
| CLARK LN | 108 |
| I70 W | 108 |
| PARIS RD | 106 |
| WORLEY ST | 100 |
| RANGE LINE ST | 92 |
| HITT ST | 86 |
| DEMARET DR | 82 |
| NINTH ST | 78 |
| PAQUIN ST | 78 |
| VANDIVER DR | 78 |
| ASH ST | 70 |
| BROADWAY E | 70 |
| ST CHARLES RD | 70 |
| OLD HIGHWAY 63 | 68 |
| GARTH AV | 66 |
| CONLEY RD | 62 |
| BROADWAY | 56 |
| I70 | 56 |
| ASHLAND RD | 52 |
| ROLLINS ST | 50 |
| COLLEGE AV | 46 |
| BROADWAY W-CO | 44 |
| HIGHWAY 63 SB | 44 |
| KEENE ST | 44 |
| Other | 3,180 |
2002 - 2018 National Fire Incident Reporting System (NFIRS) incidents
- Incident types reported to NFIRS in Columbia, MO
- 43,08757.6%Rescue & EMS
- 8,45011.3%Good Intent Call
- 7,48410.0%False Alarm
- 6,8159.1%Hazardous Condition
- 5,7907.7%Fire
- 3,0044.0%Service Call
- 930.1%Overpressure Rupture
- Fire incident types reported to NFIRS in Columbia, MO
- 2,41741.7%Structure Fires
- 2,15537.2%Outside Fires
- 1,10419.1%Mobile Property/Vehicle Fires
- 1142.0%Other
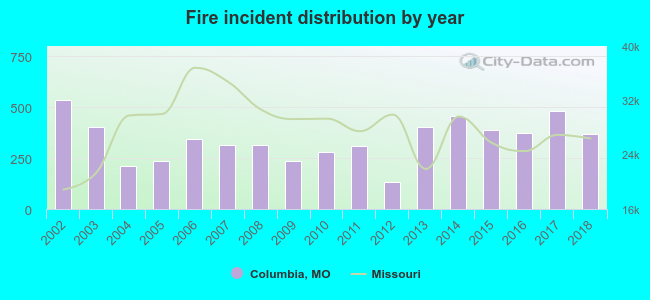 According to the data from the years 2002 - 2018 the average number of fire incidents per year is 341. The highest number of reported fires - 534 took place in 2002, and the least - 131 in 2012. The data has a decreasing trend.
The average number of yearly fire incidents per 10k residents in Columbia, MO compared to nearest cities:
(Note: Based on data for the last 3 years, including only cities with population 5,000 and above)
| Columbia: | 34.9 |
| Fulton: | 83.2 |
| Boonville: | 95.9 |
| Jefferson City: | 22.0 |
| Mexico: | 4.9 |
| Moberly: | 54.7 |
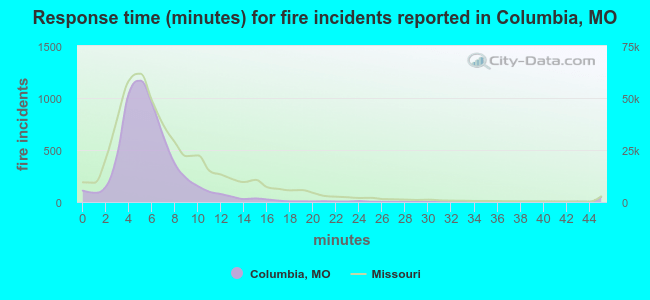 The median response time based on all reported fire incidents is 5 minutes. This is lower compared to the state median value.
The median response time in Columbia, MO compared to nearest cities:
(Note: Based on data for all years, including only cities with at least 500 fire incidents)
| Columbia: | 5 minutes |
| Fulton: | 5 minutes |
| Boonville: | 5 minutes |
| Holts Summit: | 9 minutes |
| California: | 7 minutes |
| Jefferson City: | 6 minutes |
| Mexico: | 4 minutes |
| Moberly: | 5 minutes |
| Eldon: | 7 minutes |
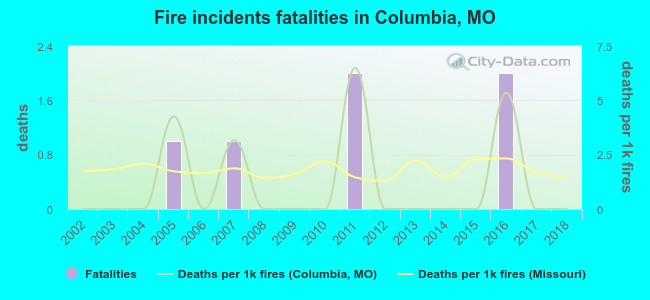 Based on the data from the years 2002 - 2018 the average number of fire-related fatalities per year is 0. The highest number of reported deaths - 2 took place in 2011, and the lowest - 0 in 2002. The data has a constant trend.
The average number of deaths per 1,000 fire incidents is 1. This indicator was the highest - 6 in 2011, and the lowest 0 in 2002. The trend for deaths per 1,000 fire incidents is constant. Compared to the Missouri value the number of deaths per 1,000 incidents is lower.
Based on the data from the years 2002 - 2018 the average number of fire-related fatalities per year is 0. The highest number of reported deaths - 2 took place in 2011, and the lowest - 0 in 2002. The data has a constant trend.
The average number of deaths per 1,000 fire incidents is 1. This indicator was the highest - 6 in 2011, and the lowest 0 in 2002. The trend for deaths per 1,000 fire incidents is constant. Compared to the Missouri value the number of deaths per 1,000 incidents is lower.Deaths per 1,000 incidents in Columbia, MO compared to nearest cities:
(Note: Based on data for all years, including only cities with at least 2,500 fire incidents)
| Columbia: | 1.0 |
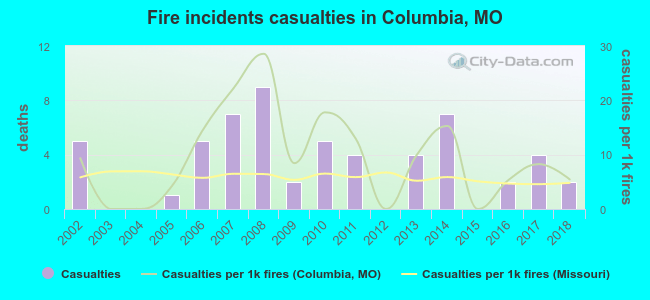 According to the data from the years 2002 - 2018 the average number of fire-related yearly casualties is 3. The highest number of reported casualties - 9 took place in 2008, and the lowest - 0 in 2003. The data has a declining trend.
The average number of injuries per 1,000 fire incidents is 10. This indicator was the highest - 29 in 2008, and the lowest 0 in 2003. The trend for casualties per 1,000 incidents is dropping. Compared to the state value the number of injuries per 1,000 incidents is higher.
According to the data from the years 2002 - 2018 the average number of fire-related yearly casualties is 3. The highest number of reported casualties - 9 took place in 2008, and the lowest - 0 in 2003. The data has a declining trend.
The average number of injuries per 1,000 fire incidents is 10. This indicator was the highest - 29 in 2008, and the lowest 0 in 2003. The trend for casualties per 1,000 incidents is dropping. Compared to the state value the number of injuries per 1,000 incidents is higher.Casualties per 1,000 incidents in Columbia, MO compared to nearest cities:
(Note: Based on data for all years, including only cities with at least 500 fire incidents)
| Columbia: | 9.8 |
| Fulton: | 5.2 |
| Boonville: | 0.0 |
| Holts Summit: | 0.0 |
| California: | 0.0 |
| Jefferson City: | 3.9 |
| Mexico: | 15.2 |
| Moberly: | 8.4 |
| Eldon: | 3.0 |
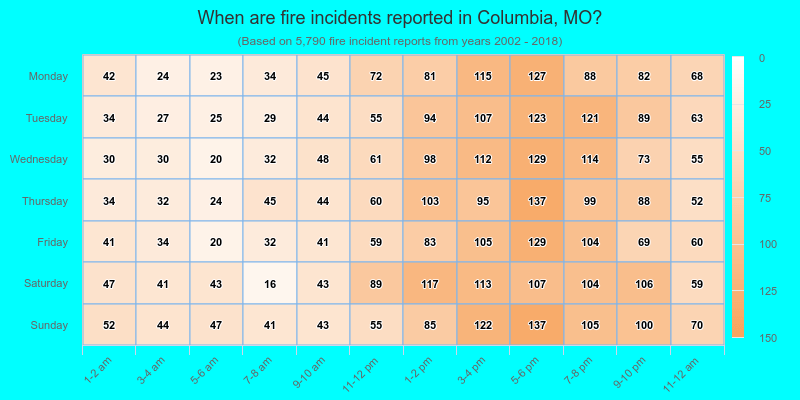
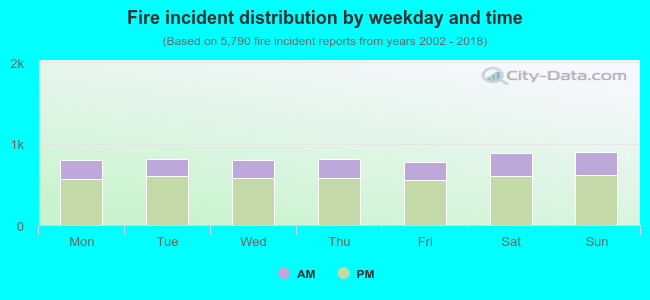 29.4% incidents where reported in the morning and 70.6% in the evening. The most fires (15.6%) took place on Sunday, and the least (13.4%) on Friday.
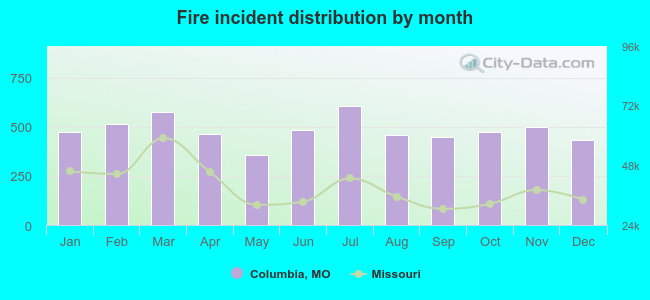 Based on the 5,790 reports from years 2002 - 2018 most fires (10.5%) took place during July, and the least (6.1%) in May.
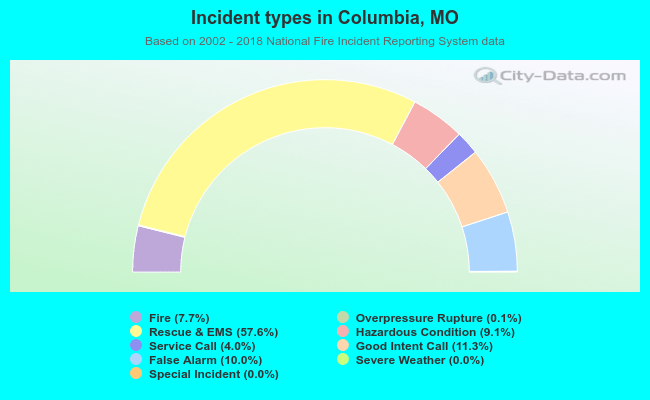 Out of all 74,787 cases reported during the years 2002 - 2018, the most belonged to the categories: Rescue & EMS (57.6%), Good Intent Call (11.3%), and False Alarm (10.0%).
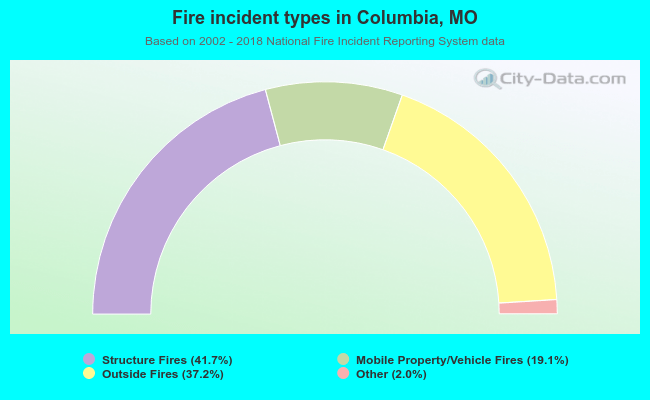 When looking into fire subcategories, the most incidents belonged to: Structure Fires (41.7%), and Outside Fires (37.2%).