Holts Summit: Fire Incidents, Missouri (MO)
Where are fire incidents reported in Holts Summit, MO
Something went wrong! Please refresh the page.
|
| |||||||||||||||||||||||||||||||||||||||||||||||||||||||||||||||||||||||||||||||||||||||||||||||||||||||||||||
| Other | 260 | |||||||||||||||||||||||||||||||||||||||||||||||||||||||||||||||||||||||||||||||||||||||||||||||||||||||||||||
2002 - 2018 National Fire Incident Reporting System (NFIRS) incidents
- Incident types reported to NFIRS in Holts Summit, MO
- 1,68152.4%Rescue & EMS
- 67621.1%Fire
- 2909.0%Hazardous Condition
- 2648.2%Good Intent Call
- 1655.1%Service Call
- 993.1%False Alarm
- 160.5%Special Incident
- 90.3%Overpressure Rupture
- 70.2%Severe Weather
- Fire incident types reported to NFIRS in Holts Summit, MO
- 29042.9%Outside Fires
- 25938.3%Structure Fires
- 10215.1%Mobile Property/Vehicle Fires
- 253.7%Other
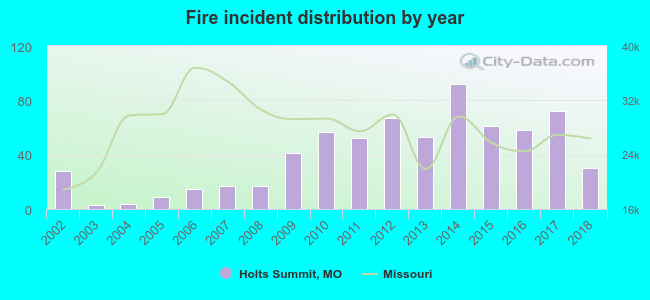 According to the data from the years 2002 - 2018 the average number of fire incidents per year is 40. The highest number of reported fires - 92 took place in 2014, and the least - 3 in 2003. The data has a rising trend.
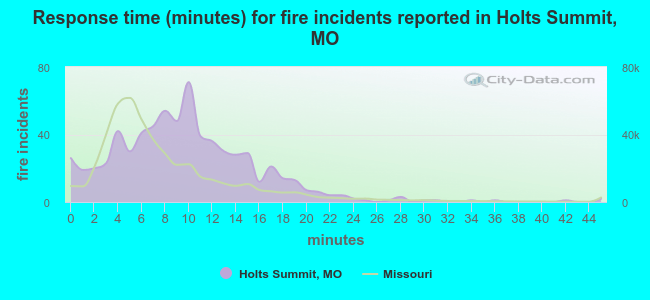 The median response time based on all reported fire incidents is 9 minutes. This is higher than the Missouri median value.
The median response time in Holts Summit, MO compared to nearest cities:
(Note: Based on data for all years, including only cities with at least 500 fire incidents)
| Holts Summit: | 9 minutes |
| Jefferson City: | 6 minutes |
| Fulton: | 5 minutes |
| Columbia: | 5 minutes |
| California: | 7 minutes |
| Eldon: | 7 minutes |
| Mexico: | 4 minutes |
| Owensville: | 11 minutes |
| Boonville: | 5 minutes |
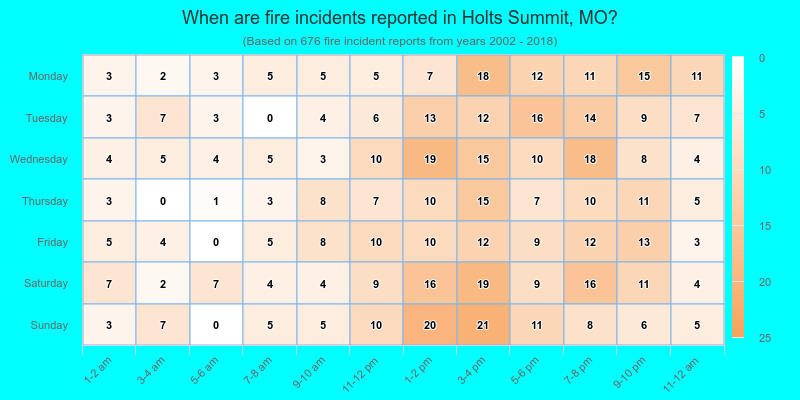
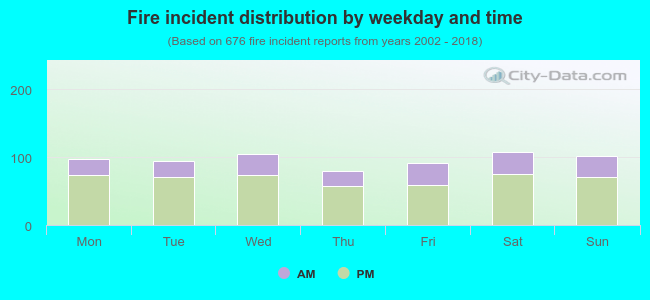 28.7% incidents where reported in the morning and 71.3% in the evening. The most fires (16.0%) took place on Saturday, and the least (11.8%) on Thursday.
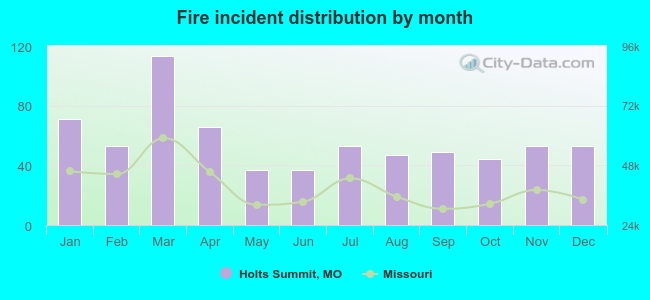 According to the 676 fire incidents from years 2002 - 2018 most fires (16.7%) took place during March, and the least (5.5%) in May.
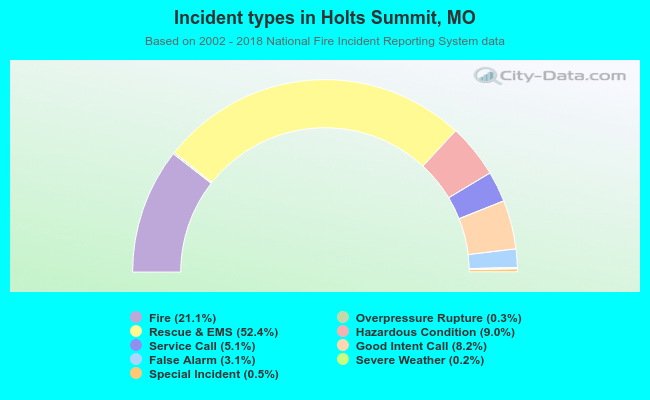 Out of all 3,207 cases reported during the years 2002 - 2018, the most belonged to the categories: Rescue & EMS (52.4%), Fire (21.1%), and Hazardous Condition (9.0%).
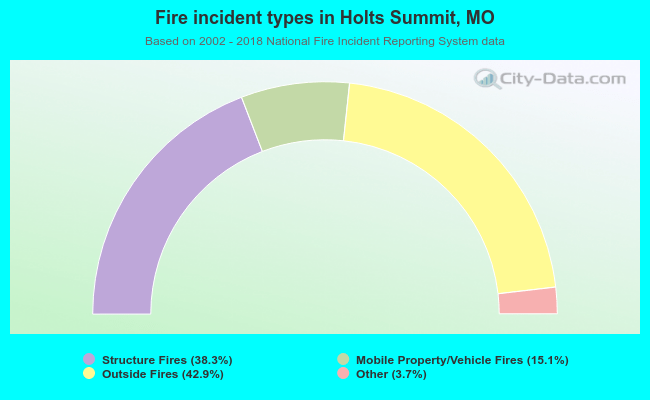 When looking into fire subcategories, the most incidents belonged to: Outside Fires (42.9%), and Structure Fires (38.3%).