Hull: Fire Incidents, Massachusetts (MA)
Where are fire incidents reported in Hull, MA
Something went wrong! Please refresh the page.
| Fire incidents reported | |
|---|---|
| Sreet name | Count |
| NANTASKET AVE | 280 |
| HULL SHORE DR | 68 |
| NANTASKET AV | 50 |
| SAMOSET AVE | 42 |
| BAY ST | 38 |
| BEACH AVE | 36 |
| NEWPORT RD | 36 |
| A ST | 32 |
| MAIN ST | 28 |
| SPRING ST | 28 |
| ATLANTIC AVE | 26 |
| NANTASKET RD | 24 |
| EDGEWATER RD | 20 |
| L ST | 20 |
| KINGSLEY RD | 18 |
| B ST | 16 |
| D ST | 16 |
| GEO WASHNGTN BLVD | 16 |
| HIGHLAND AVE | 16 |
| HILLSIDE RD | 16 |
| KENBERMA ST | 16 |
| MANOMET AVE | 16 |
| PARK AVE | 16 |
| AVALON DR | 14 |
| BEACH AV | 14 |
| E ST | 14 |
| MERRILL RD | 14 |
| G ST | 12 |
| STATE PARK RD | 12 |
| CENTRAL AVE | 10 |
2002 - 2018 National Fire Incident Reporting System (NFIRS) incidents
- Incident types reported to NFIRS in Hull, MA
- 9,82552.9%Rescue & EMS
- 3,29617.7%Hazardous Condition
- 2,01510.8%Service Call
- 1,3957.5%False Alarm
- 1,2156.5%Good Intent Call
- 7424.0%Fire
- 420.2%Severe Weather
- 320.2%Special Incident
- Fire incident types reported to NFIRS in Hull, MA
- 31742.7%Structure Fires
- 23131.1%Other
- 15020.2%Outside Fires
- 445.9%Mobile Property/Vehicle Fires
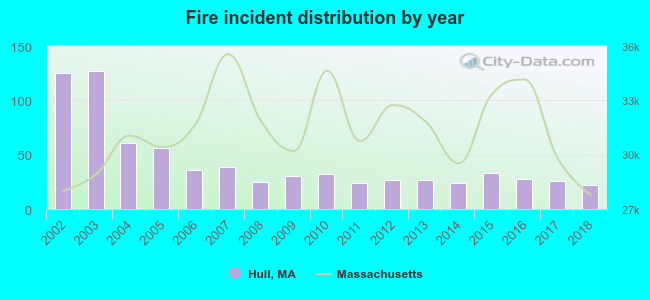 Based on the data from the years 2002 - 2018 the average number of fires per year is 44. The highest number of fires - 127 took place in 2003, and the least - 22 in 2018. The data has a decreasing trend.
The average number of yearly fire incidents per 10k residents in Hull, MA compared to nearest cities:
(Note: Based on data for the last 3 years, including only cities with population 5,000 and above)
| Hull: | 24.6 |
| Hingham: | 140.4 |
| Cohasset: | 92.4 |
| Weymouth: | 50.1 |
| Quincy: | 60.7 |
| Winthrop: | 37.1 |
| Braintree: | 24.7 |
| Norwell: | 40.0 |
| Scituate: | 125.2 |
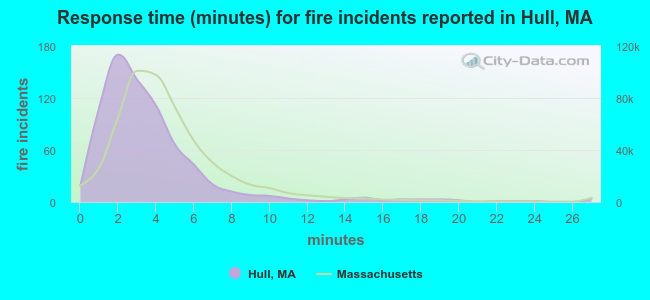 The median response time based on all reported fire incidents is 3 minutes. This is lower than the Massachusetts median value.
The median response time in Hull, MA compared to nearest cities:
(Note: Based on data for all years, including only cities with at least 500 fire incidents)
| Hull: | 3 minutes |
| Hingham: | 5 minutes |
| Cohasset: | 6 minutes |
| Weymouth: | 4 minutes |
| Quincy: | 3 minutes |
| Winthrop: | 3 minutes |
| Braintree: | 3 minutes |
| Norwell: | 5 minutes |
| Scituate: | 4 minutes |
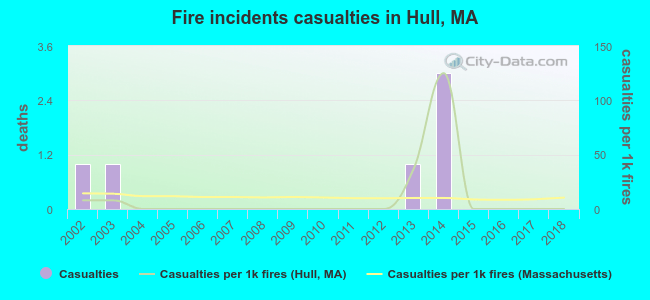 Based on the data from the years 2002 - 2018 the average number of fire-related casualties per year is 0. The highest number of reported casualties - 3 took place in 2014, and the lowest - 0 in 2004. The data has a dropping trend.
The average number of injuries per 1,000 fires is 10. This indicator was the highest - 125 in 2014, and the lowest 0 in 2004. The trend for injuries per 1,000 fires is dropping. Compared to the state value the number of injuries per 1,000 incidents is lower.
Based on the data from the years 2002 - 2018 the average number of fire-related casualties per year is 0. The highest number of reported casualties - 3 took place in 2014, and the lowest - 0 in 2004. The data has a dropping trend.
The average number of injuries per 1,000 fires is 10. This indicator was the highest - 125 in 2014, and the lowest 0 in 2004. The trend for injuries per 1,000 fires is dropping. Compared to the state value the number of injuries per 1,000 incidents is lower.
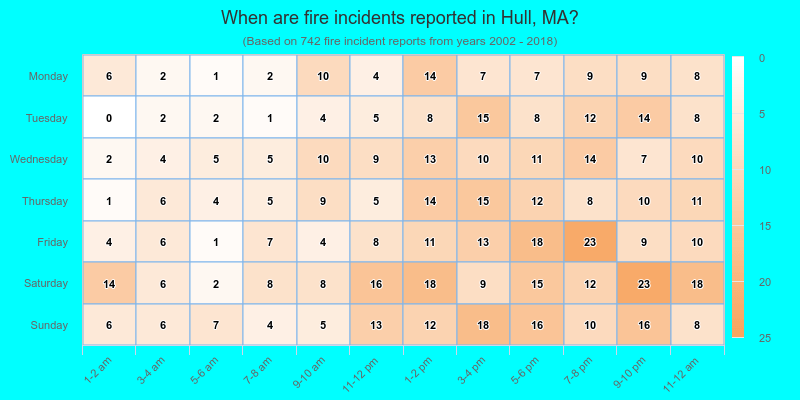
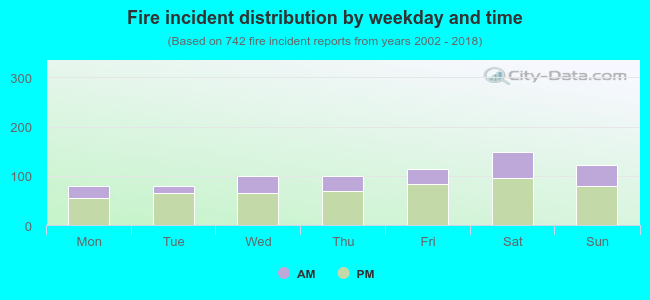 30.9% incidents where reported in the morning and 69.1% in the evening. The most fires (20.1%) took place on Saturday, and the least (10.6%) on Monday.
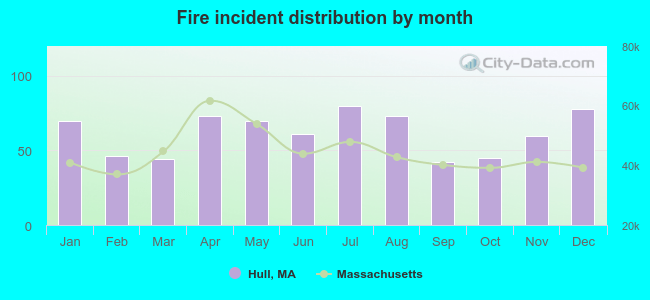 Based on the 742 fire incidents from years 2002 - 2018 most fires (10.8%) took place during July, and the least (5.7%) in September.
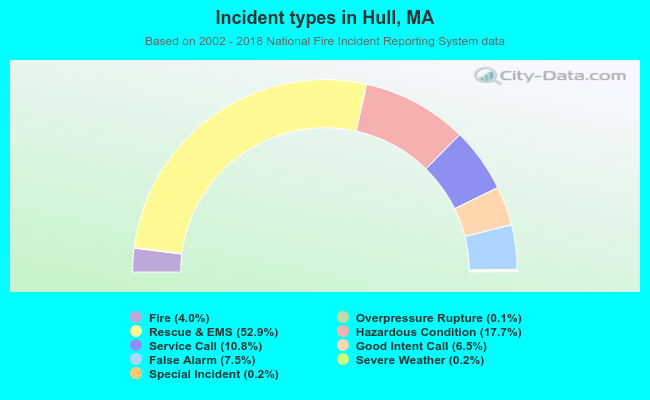 Out of all 18,574 cases reported during the years 2002 - 2018, the most belonged to the categories: Rescue & EMS (52.9%), Hazardous Condition (17.7%), and Service Call (10.8%).
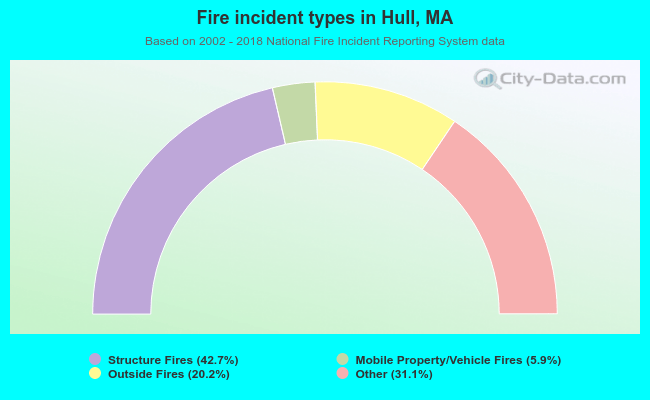 When looking into fire subcategories, the most incidents belonged to: Structure Fires (42.7%), and Other (31.1%).