Braintree: Fire Incidents, Massachusetts (MA)
Where are fire incidents reported in Braintree, MA
Something went wrong! Please refresh the page.
| Fire incidents reported | |
|---|---|
| Sreet name | Count |
| GRANITE ST | 306 |
| WASHINGTON ST | 202 |
| SKYLINE DR | 136 |
| PEARL ST | 108 |
| IVORY ST | 100 |
| MCCUSKER DR | 96 |
| GROVE ST | 92 |
| COMMERCIAL ST | 84 |
| ROUTE 3 SOUTH | 84 |
| ROUTE 93 SOUTH | 82 |
| QUINCY AVE | 74 |
| WOOD RD | 74 |
| LIBERTY ST | 72 |
| ROUTE 93 NORTH | 70 |
| UNION ST | 66 |
| GROSSMAN DR | 62 |
| POND ST | 56 |
| ROUTE 3 NORTH | 54 |
| FORBES RD | 46 |
| FRANKLIN ST | 46 |
| PLAIN ST | 40 |
| RIVER ST | 38 |
| ELM ST | 36 |
| COMMERCE DR | 32 |
| HANCOCK ST | 32 |
| HAYWARD ST | 28 |
| GRANITE ST ST | 26 |
| LAKESIDE DR | 26 |
| SHAW ST | 26 |
| ADAMS ST | 22 |
2002 - 2018 National Fire Incident Reporting System (NFIRS) incidents
- Incident types reported to NFIRS in Braintree, MA
- 17,88546.9%Rescue & EMS
- 5,89615.4%Hazardous Condition
- 4,80212.6%Service Call
- 4,66412.2%False Alarm
- 2,5566.7%Good Intent Call
- 1,9005.0%Fire
- 2890.8%Overpressure Rupture
- 1490.4%Special Incident
- Fire incident types reported to NFIRS in Braintree, MA
- 97351.2%Outside Fires
- 42322.3%Structure Fires
- 37519.7%Mobile Property/Vehicle Fires
- 1296.8%Other
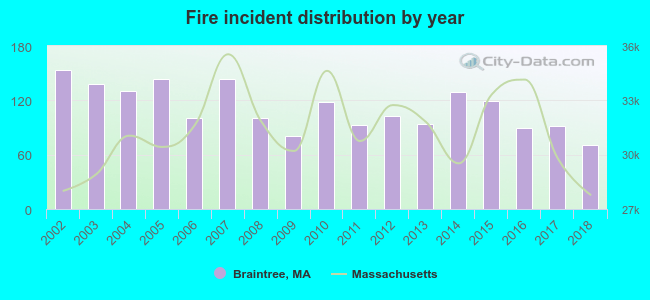 Based on the data from the years 2002 - 2018 the average number of fire incidents per year is 112. The highest number of fire incidents - 154 took place in 2002, and the least - 71 in 2018. The data has a declining trend.
The average number of yearly fire incidents per 10k residents in Braintree, MA compared to nearest cities:
(Note: Based on data for the last 3 years, including only cities with population 5,000 and above)
| Braintree: | 24.7 |
| Weymouth: | 50.1 |
| Quincy: | 60.7 |
| Randolph: | 60.2 |
| Holbrook: | 47.3 |
| Milton: | 54.6 |
| Hingham: | 140.4 |
| Abington: | 34.0 |
| Rockland: | 46.9 |
 The median response time based on all reported fire incidents is 3 minutes. This is lower than the state median value.
The median response time in Braintree, MA compared to nearest cities:
(Note: Based on data for all years, including only cities with at least 500 fire incidents)
| Braintree: | 3 minutes |
| Weymouth: | 4 minutes |
| Quincy: | 3 minutes |
| Randolph: | 3 minutes |
| Holbrook: | 3 minutes |
| Milton: | 3 minutes |
| Hingham: | 5 minutes |
| Avon: | 4 minutes |
| Abington: | 4 minutes |
 According to the data from the years 2002 - 2018 the average number of fire-related yearly casualties is 2. The highest number of reported injuries - 11 took place in 2012, and the lowest - 0 in 2002. The data has a constant trend.
The average number of injuries per 1,000 fire incidents is 15. This indicator was the highest - 107 in 2012, and the lowest 0 in 2002. The trend for injuries per 1,000 fires is constant. Compared to the state value the number of casualties per 1,000 fire incidents is higher.
According to the data from the years 2002 - 2018 the average number of fire-related yearly casualties is 2. The highest number of reported injuries - 11 took place in 2012, and the lowest - 0 in 2002. The data has a constant trend.
The average number of injuries per 1,000 fire incidents is 15. This indicator was the highest - 107 in 2012, and the lowest 0 in 2002. The trend for injuries per 1,000 fires is constant. Compared to the state value the number of casualties per 1,000 fire incidents is higher.
 29.6% incidents where reported in the morning and 70.4% in the evening. The most fires (15.6%) took place on Saturday, and the least (12.9%) on Wednesday.
 Based on the 1,900 fire incidents from years 2002 - 2018 most fires (13.6%) took place during April, and the least (4.8%) in December.
 Out of all 38,173 cases reported during the years 2002 - 2018, the most belonged to the categories: Rescue & EMS (46.9%), Hazardous Condition (15.4%), and Service Call (12.6%).
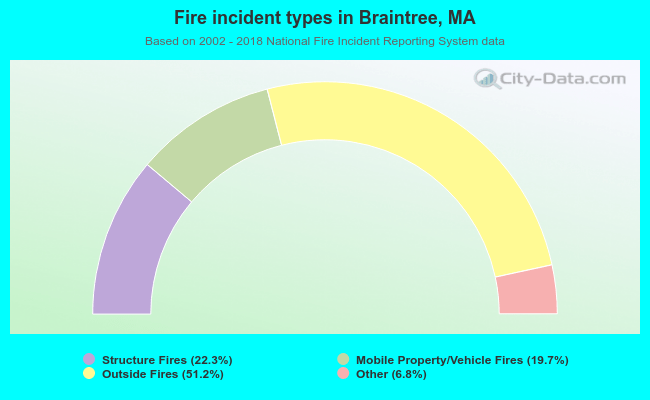 When looking into fire subcategories, the most incidents belonged to: Outside Fires (51.2%), and Structure Fires (22.3%).