Norwell: Fire Incidents, Massachusetts (MA)
Where are fire incidents reported in Norwell, MA
Something went wrong! Please refresh the page.
| Fire incidents reported | |
|---|---|
| Sreet name | Count |
| WASHINGTON ST | 346 |
| MAIN ST | 94 |
| GROVE ST | 82 |
| HIGH ST | 40 |
| WINTER ST | 36 |
| LONGWATER DR | 30 |
| RIVER ST | 30 |
| CROSS ST | 26 |
| LONGWATER CIR | 24 |
| PROSPECT ST | 24 |
| ROUTE 3 - SOUTH OF 53 | 24 |
| SUMMER ST | 24 |
| MOUNT BLUE ST | 22 |
| POND ST | 22 |
| SOUTH ST | 22 |
| MT BLUE ST | 20 |
| OLD OAKEN BUCKET RD | 20 |
| CIRCUIT ST | 18 |
| FARRAR FARM RD | 18 |
| LINCOLN ST | 18 |
| ROUTE 3 - SOUTH OF 228 | 18 |
| BRIGANTINE CIR | 16 |
| FOREST ST | 16 |
| RIVERSIDE DR | 16 |
| ROUTE 3 - NORTH OF 139 | 16 |
| ROUTE 3 SOUTH OF 53 | 16 |
| STETSON RD | 16 |
| ACCORD PARK DR | 14 |
| ASSINIPPI AVE | 14 |
| PINE ST | 14 |
2002 - 2018 National Fire Incident Reporting System (NFIRS) incidents
- Incident types reported to NFIRS in Norwell, MA
- 5,61139.1%Rescue & EMS
- 4,21929.4%Hazardous Condition
- 1,4199.9%Service Call
- 1,2899.0%False Alarm
- 8806.1%Fire
- 8035.6%Good Intent Call
- 1180.8%Severe Weather
- Fire incident types reported to NFIRS in Norwell, MA
- 37542.6%Structure Fires
- 35139.9%Outside Fires
- 13615.5%Mobile Property/Vehicle Fires
- 182.0%Other
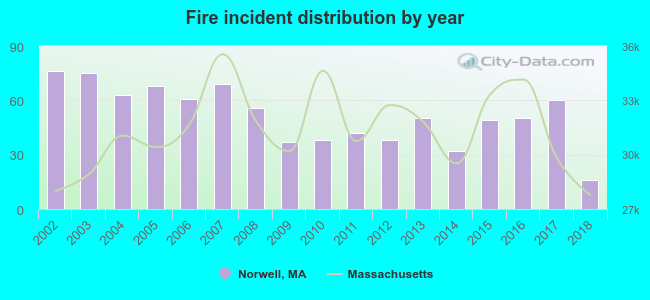 According to the data from the years 2002 - 2018 the average number of fires per year is 52. The highest number of reported fires - 76 took place in 2002, and the least - 16 in 2018. The data has a decreasing trend.
The average number of yearly fire incidents per 10k residents in Norwell, MA compared to nearest cities:
(Note: Based on data for the last 3 years, including only cities with population 5,000 and above)
| Norwell: | 40.0 |
| Hanover: | 38.7 |
| Rockland: | 46.9 |
| Scituate: | 125.2 |
| Pembroke: | 3.6 |
| Cohasset: | 92.4 |
| Hingham: | 140.4 |
| Abington: | 34.0 |
| Weymouth: | 50.1 |
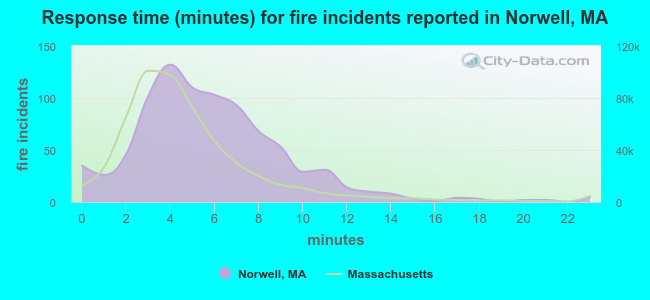 The median response time based on all reported fire incidents is 5 minutes. This is higher compared to the Massachusetts median value.
The median response time in Norwell, MA compared to nearest cities:
(Note: Based on data for all years, including only cities with at least 500 fire incidents)
| Norwell: | 5 minutes |
| Hanover: | 5 minutes |
| Rockland: | 3 minutes |
| Scituate: | 4 minutes |
| Hanson: | 5 minutes |
| Cohasset: | 6 minutes |
| Hingham: | 5 minutes |
| Abington: | 4 minutes |
| Marshfield: | 4 minutes |
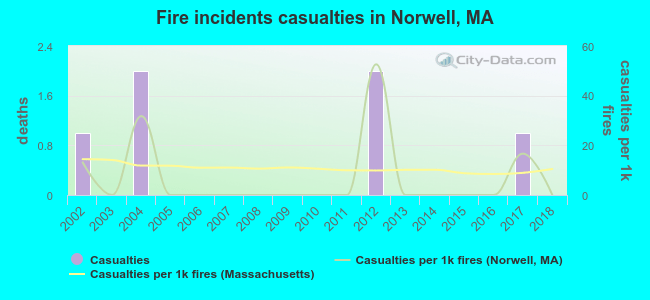 According to the data from the years 2002 - 2018 the average number of fire-related yearly casualties is 0. The highest number of reported injuries - 2 took place in 2004, and the lowest - 0 in 2003. The data has a decreasing trend.
The average number of injuries per 1,000 fires is 7. This indicator was the highest - 53 in 2012, and the lowest 0 in 2003. The trend for injuries per 1,000 incidents is decreasing. Compared to the state value the number of injuries per 1,000 fire incidents is lower.
According to the data from the years 2002 - 2018 the average number of fire-related yearly casualties is 0. The highest number of reported injuries - 2 took place in 2004, and the lowest - 0 in 2003. The data has a decreasing trend.
The average number of injuries per 1,000 fires is 7. This indicator was the highest - 53 in 2012, and the lowest 0 in 2003. The trend for injuries per 1,000 incidents is decreasing. Compared to the state value the number of injuries per 1,000 fire incidents is lower.
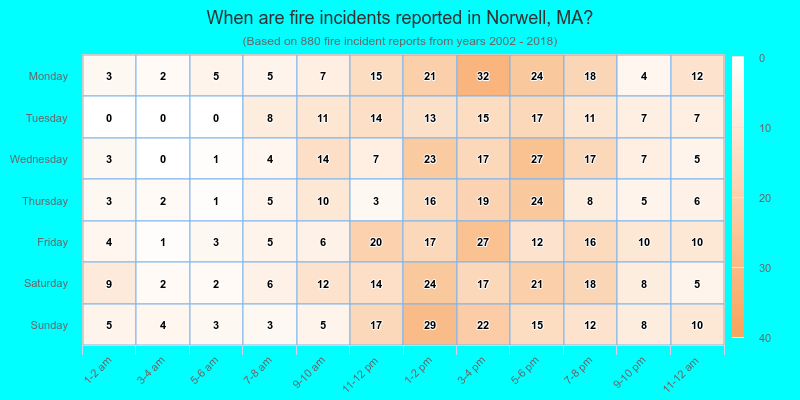
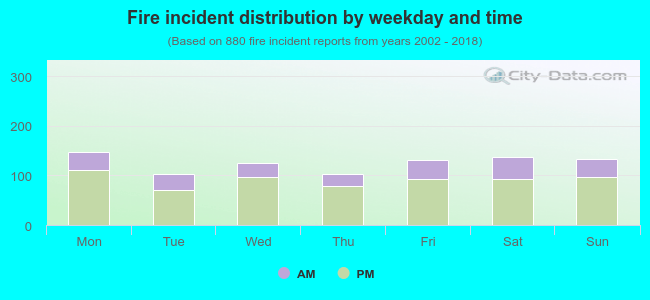 27.7% incidents where reported in the morning and 72.3% in the evening. The most fires (16.8%) took place on Monday, and the least (11.6%) on Thursday.
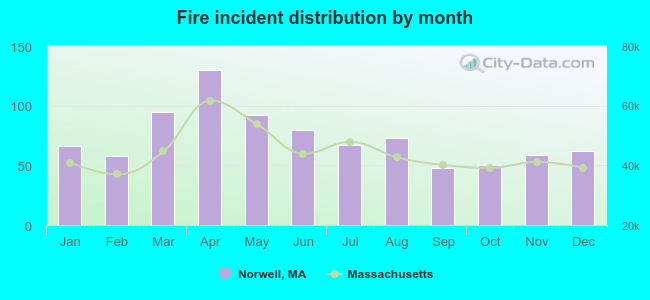 According to the 880 fire incidents from years 2002 - 2018 most fires (14.8%) took place during April, and the least (5.5%) in September.
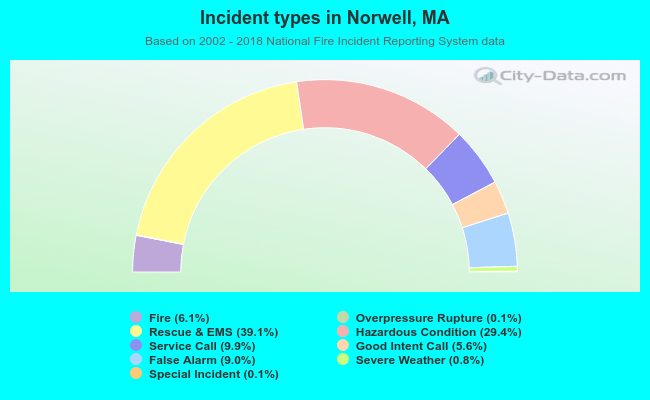 Out of all 14,363 cases reported during the years 2002 - 2018, the most belonged to the categories: Rescue & EMS (39.1%), Hazardous Condition (29.4%), and Service Call (9.9%).
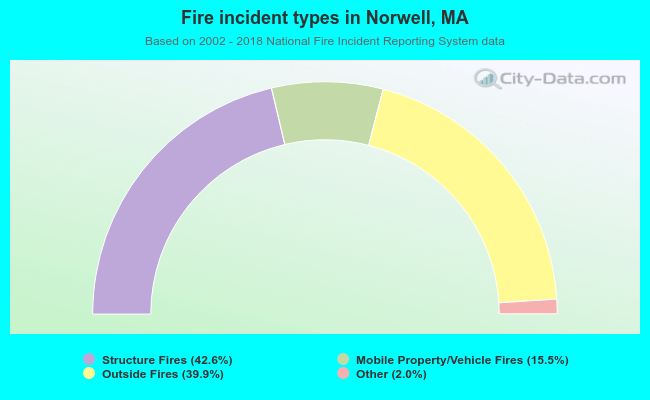 When looking into fire subcategories, the most reports belonged to: Structure Fires (42.6%), and Outside Fires (39.9%).