Marshfield: Fire Incidents, Massachusetts (MA)
Where are fire incidents reported in Marshfield, MA
Something went wrong! Please refresh the page.
| Fire incidents reported | |
|---|---|
| Sreet name | Count |
| OCEAN ST | 410 |
| PLAIN ST | 248 |
| WINSLOW VILLAGE | 134 |
| MAIN ST | 108 |
| FOREST ST | 92 |
| FERRY ST | 82 |
| UNION ST | 74 |
| WEBSTER ST | 72 |
| SNOW RD | 66 |
| TEA ROCK GARDENS | 62 |
| SOUTH RIVER ST | 60 |
| FOX RUN | 48 |
| CARESWELL ST | 46 |
| SCHOOL ST | 46 |
| SUMMER ST | 42 |
| HIGHLAND ST | 38 |
| MORAINE ST | 38 |
| BAY AVE | 34 |
| CASTLE GREEN APARTMENTS | 30 |
| FOSTER AVE | 30 |
| MUTUAL AID TO MARSHFIELD | 30 |
| STANDISH ST | 30 |
| KENT AVE | 28 |
| BEACH ST | 26 |
| CLAYPIT RD | 26 |
| ROYAL DANE DR | 26 |
| STEAMBOAT DR | 24 |
| TOWN PIER RD | 22 |
| CANAL ST | 20 |
| HOLLY RD | 20 |
2002 - 2018 National Fire Incident Reporting System (NFIRS) incidents
- Incident types reported to NFIRS in Marshfield, MA
- 11,76749.7%Rescue & EMS
- 4,80020.3%Hazardous Condition
- 2,2329.4%Service Call
- 2,1038.9%False Alarm
- 1,9218.1%Fire
- 7743.3%Good Intent Call
- 440.2%Special Incident
- 340.1%Severe Weather
- Fire incident types reported to NFIRS in Marshfield, MA
- 88346.0%Structure Fires
- 80642.0%Outside Fires
- 1527.9%Mobile Property/Vehicle Fires
- 804.2%Other
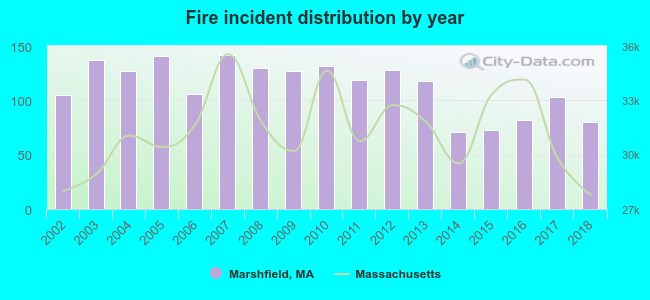 According to the data from the years 2002 - 2018 the average number of fires per year is 113. The highest number of reported fires - 142 took place in 2007, and the least - 71 in 2014. The data has a decreasing trend.
 The median response time based on all reported fire incidents is 4 minutes. This is about the same as the Massachusetts median value.
The median response time in Marshfield, MA compared to nearest cities:
(Note: Based on data for all years, including only cities with at least 500 fire incidents)
| Marshfield: | 4 minutes |
| Duxbury: | 4 minutes |
| Scituate: | 4 minutes |
| Norwell: | 5 minutes |
| Kingston: | 6 minutes |
| Hanson: | 5 minutes |
| Hanover: | 5 minutes |
| Plymouth: | 5 minutes |
| Rockland: | 3 minutes |
 According to the data from the years 2002 - 2018 the average number of fire-related yearly deaths is 0. The highest number of deaths - 2 took place in 2007, and the lowest - 0 in 2002. The data has a constant trend.
 According to the reports from the years 2002 - 2018 the average number of fire-related yearly casualties is 2. The highest number of injuries - 7 took place in 2004, and the lowest - 0 in 2008. The data has a dropping trend.
The average number of injuries per 1,000 fire incidents is 13. This indicator was the highest - 55 in 2004, and the lowest 0 in 2008. The trend for injuries per 1,000 fires is decreasing. Compared to the state value the number of casualties per 1,000 incidents is higher.
According to the reports from the years 2002 - 2018 the average number of fire-related yearly casualties is 2. The highest number of injuries - 7 took place in 2004, and the lowest - 0 in 2008. The data has a dropping trend.
The average number of injuries per 1,000 fire incidents is 13. This indicator was the highest - 55 in 2004, and the lowest 0 in 2008. The trend for injuries per 1,000 fires is decreasing. Compared to the state value the number of casualties per 1,000 incidents is higher.
 28.6% incidents where reported in the morning and 71.4% in the evening. The most fires (16.4%) took place on Sunday, and the least (11.8%) on Thursday.
 According to the 1,921 reports from years 2002 - 2018 most fires (13.1%) took place during July, and the least (5.1%) in October.
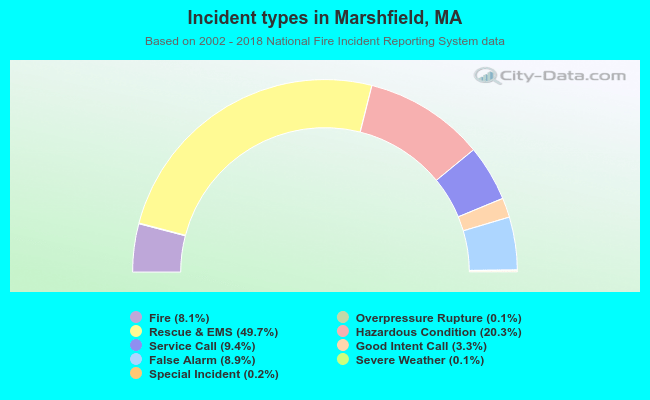 Out of all 23,695 cases reported during the years 2002 - 2018, the most belonged to the categories: Rescue & EMS (49.7%), Hazardous Condition (20.3%), and Service Call (9.4%).
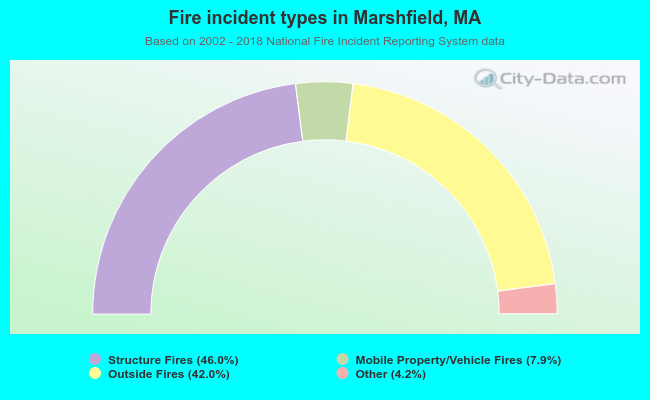 When looking into fire subcategories, the most incidents belonged to: Structure Fires (46.0%), and Outside Fires (42.0%).