Houston: Fire Incidents, Texas (TX)
Where are fire incidents reported in Houston, TX
Something went wrong! Please refresh the page.
| Fire incidents reported | |
|---|---|
| Sreet name | Count |
| FM 1960 | 2,448 |
| WESTHEIMER RD | 1,598 |
| LOOP | 1,462 |
| SAM HOUSTON PKWY | 1,442 |
| LITTLE YORK RD | 1,278 |
| GULF FWY | 1,274 |
| IH 610 | 1,274 |
| TIDWELL RD | 1,198 |
| RICHMOND AVE | 1,166 |
| NORTH FWY | 1,160 |
| BISSONNET ST | 1,158 |
| IH 45 | 1,132 |
| GESSNER DR | 1,088 |
| BELLFORT ST | 1,066 |
| US 59 | 1,050 |
| FONDREN RD | 1,032 |
| ANTOINE DR | 934 |
| BELLAIRE BLVD | 902 |
| BEECHNUT ST | 882 |
| IH 10 | 840 |
| GREENS RD | 826 |
| SOUTHWEST FWY | 826 |
| NORTHWEST FWY | 788 |
| KATY FWY | 770 |
| CYPRESS STATION DR | 744 |
| IMPERIAL VALLEY DR | 730 |
| SH 6 | 696 |
| BROADWAY ST | 670 |
| ELLA BLVD | 664 |
| BW 8 | 662 |
| Other | 84,817 |
2002 - 2018 National Fire Incident Reporting System (NFIRS) incidents
- Incident types reported to NFIRS in Houston, TX
- 605,53954.6%Rescue & EMS
- 135,19212.2%Good Intent Call
- 116,57710.5%Fire
- 115,06510.4%False Alarm
- 81,4947.4%Hazardous Condition
- 52,3704.7%Service Call
- Fire incident types reported to NFIRS in Houston, TX
- 44,41838.1%Outside Fires
- 40,05534.4%Structure Fires
- 25,93822.2%Mobile Property/Vehicle Fires
- 6,1665.3%Other
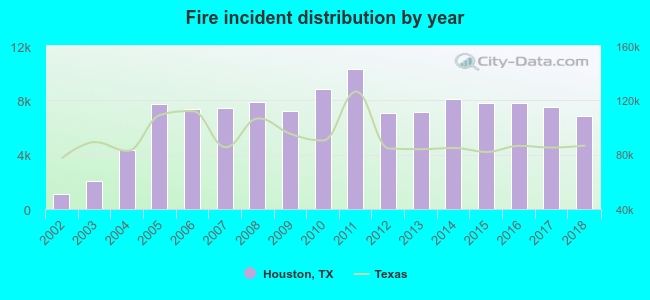 According to the data from the years 2002 - 2018 the average number of fires per year is 6,857. The highest number of fire incidents - 10,311 took place in 2011, and the least - 1,108 in 2002. The data has an increasing trend.
The average number of yearly fire incidents per 10k residents in Houston, TX compared to nearest cities:
(Note: Based on data for the last 3 years, including only cities with population 5,000 and above)
| Houston: | 33.1 |
| Bellaire: | 17.9 |
| Jacinto City: | 2.5 |
| Galena Park: | 17.9 |
| Aldine: | 1.6 |
| South Houston: | 1.1 |
| Cloverleaf: | 0.6 |
| Pasadena: | 10.7 |
| Jersey Village: | 29.9 |
 The median response time based on all reported fire incidents is 6 minutes. This is similar to the state median value.
The median response time in Houston, TX compared to nearest cities:
(Note: Based on data for all years, including only cities with at least 500 fire incidents)
| Houston: | 6 minutes |
| Bellaire: | 4 minutes |
| Pasadena: | 7 minutes |
| Stafford: | 7 minutes |
| Pearland: | 7 minutes |
| Missouri City: | 7 minutes |
| Channelview: | 7 minutes |
| Deer Park: | 5 minutes |
| Fresno: | 11 minutes |
 According to the reports from the years 2002 - 2018 the average number of fire-related fatalities per year is 11. The highest number of deaths - 28 took place in 2011, and the lowest - 0 in 2002. The data has a growing trend.
The average number of fatalities per 1,000 fire incidents is 1. This indicator was the highest - 4 in 2012, and the lowest 0 in 2002. The trend for fatalities per 1,000 fires is increasing. Compared to the Texas value the number of fatalities per 1,000 fire incidents is similar.
According to the reports from the years 2002 - 2018 the average number of fire-related fatalities per year is 11. The highest number of deaths - 28 took place in 2011, and the lowest - 0 in 2002. The data has a growing trend.
The average number of fatalities per 1,000 fire incidents is 1. This indicator was the highest - 4 in 2012, and the lowest 0 in 2002. The trend for fatalities per 1,000 fires is increasing. Compared to the Texas value the number of fatalities per 1,000 fire incidents is similar.Deaths per 1,000 incidents in Houston, TX compared to nearest cities:
(Note: Based on data for all years, including only cities with at least 2,500 fire incidents)
| Houston: | 1.6 |
| Pasadena: | 1.3 |
| Pearland: | 1.2 |
| Missouri City: | 1.5 |
| Channelview: | 3.8 |
| Humble: | 2.0 |
| Sugar Land: | 3.2 |
| Spring: | 1.4 |
| Crosby: | 2.0 |
 According to the data from the years 2002 - 2018 the average number of fire-related casualties per year is 46. The highest number of injuries - 93 took place in 2015, and the lowest - 4 in 2002. The data has a growing trend.
The average number of casualties per 1,000 fire incidents is 6. This indicator was the highest - 12 in 2015, and the lowest 2 in 2006. The trend for casualties per 1,000 fire incidents is rising. Compared to the Texas value the number of injuries per 1,000 incidents is similar.
According to the data from the years 2002 - 2018 the average number of fire-related casualties per year is 46. The highest number of injuries - 93 took place in 2015, and the lowest - 4 in 2002. The data has a growing trend.
The average number of casualties per 1,000 fire incidents is 6. This indicator was the highest - 12 in 2015, and the lowest 2 in 2006. The trend for casualties per 1,000 fire incidents is rising. Compared to the Texas value the number of injuries per 1,000 incidents is similar.Casualties per 1,000 incidents in Houston, TX compared to nearest cities:
(Note: Based on data for all years, including only cities with at least 500 fire incidents)
| Houston: | 6.7 |
| Bellaire: | 4.5 |
| Pasadena: | 3.2 |
| Stafford: | 6.0 |
| Pearland: | 3.1 |
| Missouri City: | 15.7 |
| Channelview: | 7.3 |
| Deer Park: | 9.2 |
| Fresno: | 3.4 |
 33.7% incidents where reported in the morning and 66.3% in the evening. The most fires (15.8%) took place on Sunday, and the least (13.1%) on Wednesday.
 Based on the 116,577 incident reports from years 2002 - 2018 most fires (9.5%) took place during January, and the least (7.5%) in September.
 Out of all 1,108,642 cases reported during the years 2002 - 2018, the most belonged to the categories: Rescue & EMS (54.6%), Good Intent Call (12.2%), and Fire (10.5%).
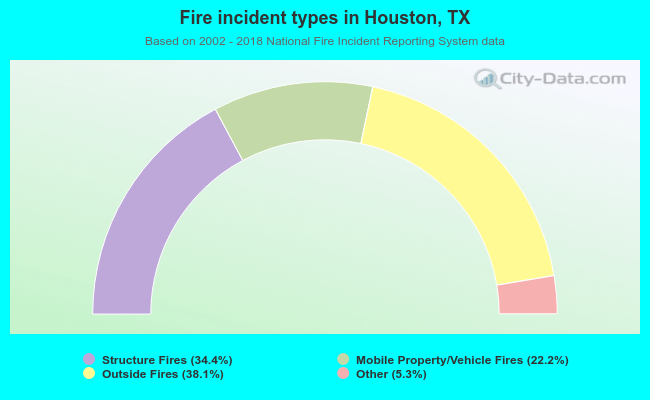 When looking into fire subcategories, the most incidents belonged to: Outside Fires (38.1%), and Structure Fires (34.4%).