Stafford: Fire Incidents, Texas (TX)
Where are fire incidents reported in Stafford, TX
Something went wrong! Please refresh the page.
| Fire incidents reported | |
|---|---|
| Sreet name | Count |
| FOUNTAIN LAKE DR | 82 |
| FM 1092 | 72 |
| FIFTH ST | 64 |
| STAFFORD RD | 56 |
| DULLES AVE | 54 |
| FREEWAY | 54 |
| KIRKWOOD | 50 |
| CASH RD | 46 |
| DOVE COUNTRY DR | 46 |
| DULLES | 40 |
| MAIN ST | 36 |
| BRAND LN | 34 |
| KIRKWOOD RD | 34 |
| SOUTHWEST FWY | 32 |
| 5TH ST | 30 |
| DOVE COUNTRY | 28 |
| 5TH | 26 |
| FARRAH LN | 26 |
| INDUSTRIAL BLVD | 26 |
| MAIN | 26 |
| PACKER | 26 |
| PACKER LN | 26 |
| SUMMER PARK DR | 26 |
| SW FREEWAY | 24 |
| GROVE WEST BLVD | 22 |
| CASH | 18 |
| FOUNTAIN LAKE CIR | 18 |
| MURPHY | 18 |
| SUGAR GROVE BLVD | 18 |
| AIRPORT BLVD | 16 |
| Other | 265 |
2002 - 2018 National Fire Incident Reporting System (NFIRS) incidents
- Incident types reported to NFIRS in Stafford, TX
- 6,46849.2%Rescue & EMS
- 1,70112.9%False Alarm
- 1,65512.6%Good Intent Call
- 1,33910.2%Fire
- 1,2899.8%Service Call
- 6374.8%Hazardous Condition
- 260.2%Special Incident
- 200.2%Overpressure Rupture
- Fire incident types reported to NFIRS in Stafford, TX
- 81260.6%Structure Fires
- 34025.4%Outside Fires
- 16011.9%Mobile Property/Vehicle Fires
- 272.0%Other
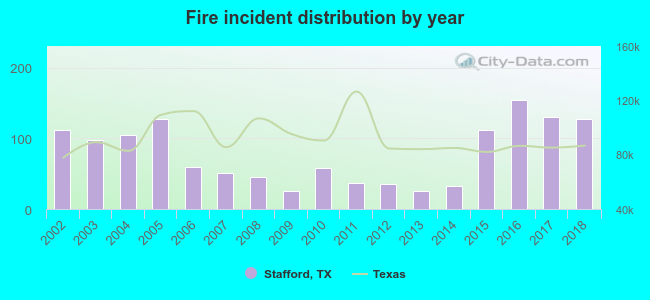 Based on the data from the years 2002 - 2018 the average number of fire incidents per year is 79. The highest number of reported fires - 154 took place in 2016, and the least - 25 in 2009. The data has a growing trend.
The average number of yearly fire incidents per 10k residents in Stafford, TX compared to nearest cities:
(Note: Based on data for the last 3 years, including only cities with population 5,000 and above)
| Stafford: | 75.0 |
| Meadows Place: | 2.9 |
| Missouri City: | 28.7 |
| Sugar Land: | 18.3 |
| Bellaire: | 17.9 |
| Fresno: | 16.6 |
| Richmond: | 151.4 |
| Houston: | 33.1 |
| Rosenberg: | 59.4 |
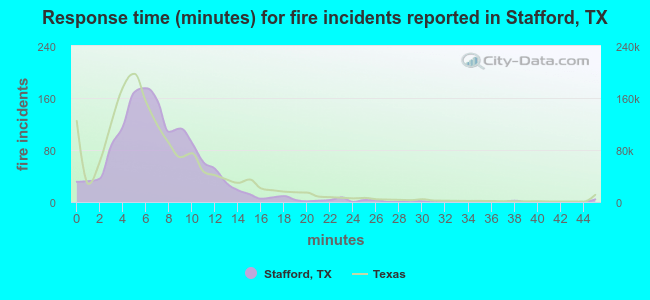 The median response time based on all reported fire incidents is 7 minutes. This is comparable to the Texas median value.
The median response time in Stafford, TX compared to nearest cities:
(Note: Based on data for all years, including only cities with at least 500 fire incidents)
| Stafford: | 7 minutes |
| Missouri City: | 7 minutes |
| Sugar Land: | 6 minutes |
| Bellaire: | 4 minutes |
| Fresno: | 11 minutes |
| Richmond: | 6 minutes |
| Houston: | 6 minutes |
| Rosenberg: | 6 minutes |
| Manvel: | 7 minutes |
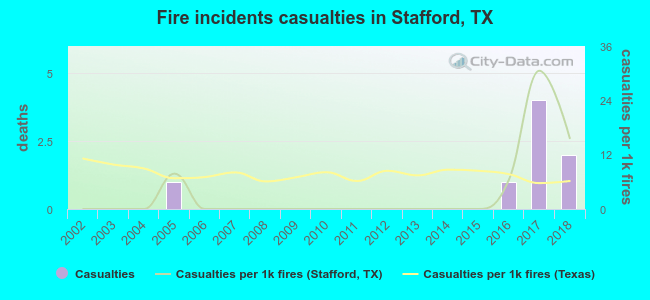 Based on the reports from the years 2002 - 2018 the average number of fire-related yearly casualties is 0. The highest number of reported injuries - 4 took place in 2017, and the lowest - 0 in 2002. The data has a rising trend.
The average number of injuries per 1,000 fire incidents is 4. This indicator was the highest - 31 in 2017, and the lowest 0 in 2002. The trend for casualties per 1,000 fires is increasing. Compared to the Texas value the number of injuries per 1,000 incidents is lower.
Based on the reports from the years 2002 - 2018 the average number of fire-related yearly casualties is 0. The highest number of reported injuries - 4 took place in 2017, and the lowest - 0 in 2002. The data has a rising trend.
The average number of injuries per 1,000 fire incidents is 4. This indicator was the highest - 31 in 2017, and the lowest 0 in 2002. The trend for casualties per 1,000 fires is increasing. Compared to the Texas value the number of injuries per 1,000 incidents is lower.Casualties per 1,000 incidents in Stafford, TX compared to nearest cities:
(Note: Based on data for all years, including only cities with at least 500 fire incidents)
| Stafford: | 6.0 |
| Missouri City: | 15.7 |
| Sugar Land: | 6.4 |
| Bellaire: | 4.5 |
| Fresno: | 3.4 |
| Richmond: | 6.1 |
| Houston: | 6.7 |
| Rosenberg: | 10.6 |
| Manvel: | 0.0 |
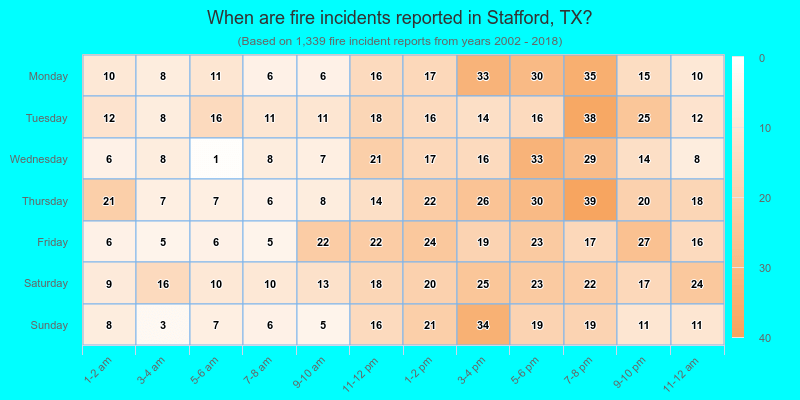
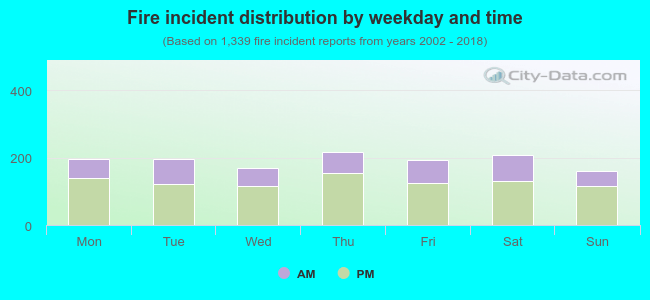 32.4% incidents where reported in the morning and 67.6% in the evening. The most fires (16.3%) took place on Thursday, and the least (11.9%) on Sunday.
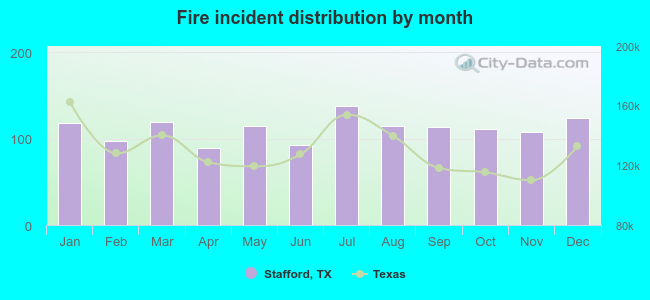 Based on the 1,339 fire incident reports from years 2002 - 2018 most fires (10.3%) took place during July, and the least (6.6%) in April.
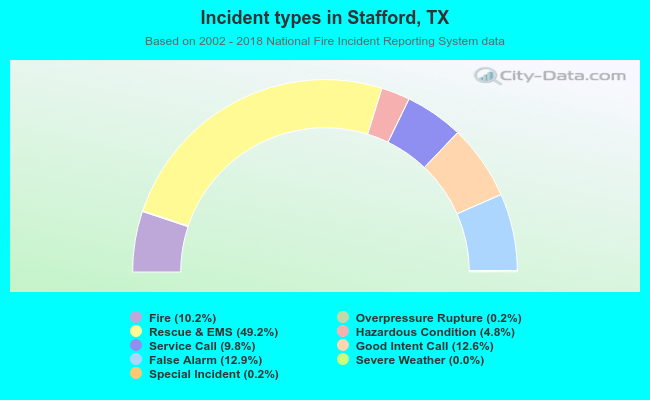 Out of all 13,140 cases reported during the years 2002 - 2018, the most belonged to the categories: Rescue & EMS (49.2%), False Alarm (12.9%), and Good Intent Call (12.6%).
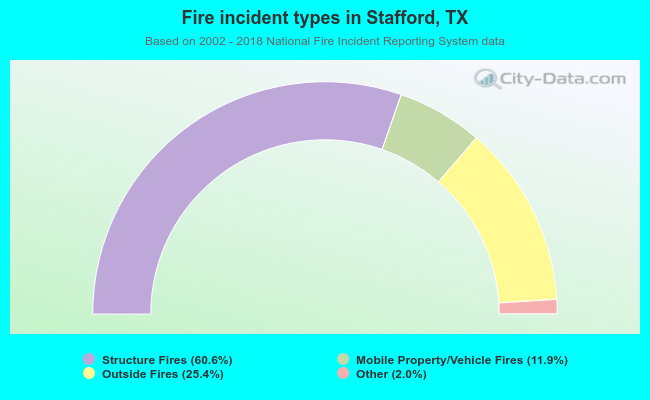 When looking into fire subcategories, the most reports belonged to: Structure Fires (60.6%), and Outside Fires (25.4%).