Pearland: Fire Incidents, Texas (TX)
Where are fire incidents reported in Pearland, TX
Something went wrong! Please refresh the page.
| Fire incidents reported | |
|---|---|
| Sreet name | Count |
| BROADWAY ST | 572 |
| MAIN ST | 148 |
| 288 HWY | 64 |
| BUSINESS CENTER DR | 64 |
| OAK RD | 54 |
| SHADOW CREEK | 48 |
| BROADWAY | 46 |
| GARDEN RD | 46 |
| OLD ALVIN RD | 44 |
| PEARLAND | 40 |
| BAILEY RD | 38 |
| CR 127 | 36 |
| CULLEN BLVD | 36 |
| SHADOW CREEK PKWY | 34 |
| ORANGE ST | 32 |
| WALNUT ST | 32 |
| DIXIE FARM RD | 30 |
| FITE RD | 30 |
| ODAY RD | 30 |
| HARKEY RD | 28 |
| MAIN HWY | 28 |
| CR 48 | 26 |
| HATFIELD RD | 26 |
| MCLEAN RD | 26 |
| MAX RD | 24 |
| SH 288 | 24 |
| SH 288 HWY | 24 |
| CR 59 | 22 |
| WEST BROADWAY | 20 |
| WHISPERING WINDS DR | 20 |
| Other | 1,533 |
2003 - 2018 National Fire Incident Reporting System (NFIRS) incidents
- Incident types reported to NFIRS in Pearland, TX
- 19,35759.5%Rescue & EMS
- 3,2259.9%Fire
- 2,8328.7%Good Intent Call
- 2,7528.5%Hazardous Condition
- 2,6168.0%False Alarm
- 1,6825.2%Service Call
- Fire incident types reported to NFIRS in Pearland, TX
- 1,40343.5%Outside Fires
- 1,23938.4%Structure Fires
- 48315.0%Mobile Property/Vehicle Fires
- 1003.1%Other
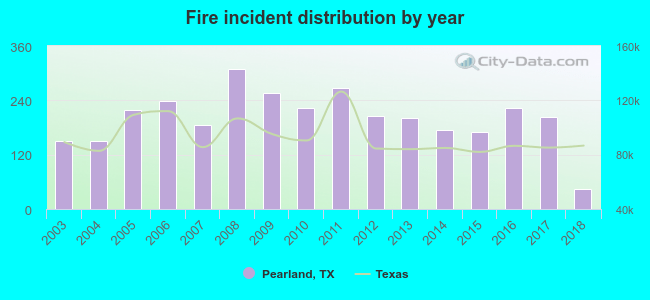 According to the data from the years 2003 - 2018 the average number of fire incidents per year is 201. The highest number of fires - 309 took place in 2008, and the least - 44 in 2018. The data has a declining trend.
The average number of yearly fire incidents per 10k residents in Pearland, TX compared to nearest cities:
(Note: Based on data for the last 3 years, including only cities with population 5,000 and above)
| Pearland: | 15.1 |
| Manvel: | 42.3 |
| Friendswood: | 21.8 |
| South Houston: | 1.1 |
| Fresno: | 16.6 |
| Webster: | 63.6 |
| Pasadena: | 10.7 |
| Alvin: | 57.1 |
| League City: | 15.7 |
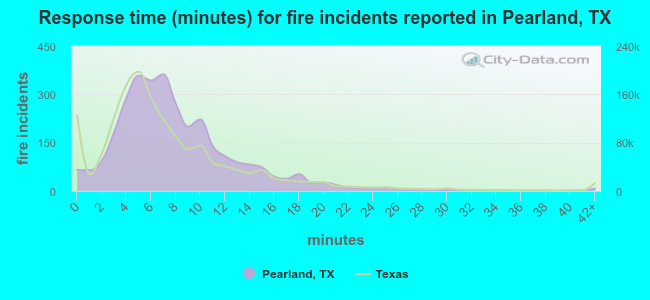 The median response time based on all reported fire incidents is 7 minutes. This is close to the Texas median value.
The median response time in Pearland, TX compared to nearest cities:
(Note: Based on data for all years, including only cities with at least 500 fire incidents)
| Pearland: | 7 minutes |
| Manvel: | 7 minutes |
| Friendswood: | 5 minutes |
| Fresno: | 11 minutes |
| Webster: | 5 minutes |
| Pasadena: | 7 minutes |
| Alvin: | 7 minutes |
| League City: | 7 minutes |
| Deer Park: | 5 minutes |
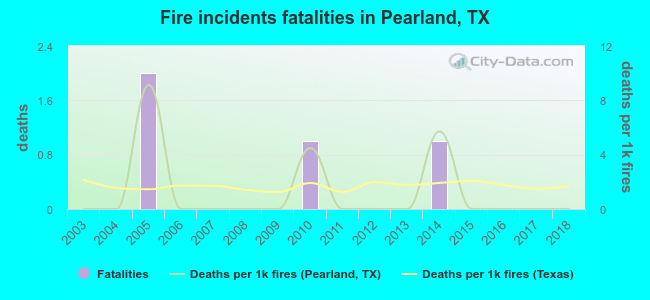 According to the data from the years 2003 - 2018 the average number of fire-related yearly deaths is 0. The highest number of reported deaths - 2 took place in 2005, and the lowest - 0 in 2003. The data has a constant trend.
The average number of deaths per 1,000 fire incidents is 1. This indicator was the highest - 9 in 2005, and the lowest 0 in 2003. The trend for fatalities per 1,000 fire incidents is constant. Compared to the state value the number of fatalities per 1,000 incidents is lower.
According to the data from the years 2003 - 2018 the average number of fire-related yearly deaths is 0. The highest number of reported deaths - 2 took place in 2005, and the lowest - 0 in 2003. The data has a constant trend.
The average number of deaths per 1,000 fire incidents is 1. This indicator was the highest - 9 in 2005, and the lowest 0 in 2003. The trend for fatalities per 1,000 fire incidents is constant. Compared to the state value the number of fatalities per 1,000 incidents is lower.Deaths per 1,000 incidents in Pearland, TX compared to nearest cities:
(Note: Based on data for all years, including only cities with at least 2,500 fire incidents)
| Pearland: | 1.2 |
| Pasadena: | 1.3 |
| Alvin: | 0.0 |
| Missouri City: | 1.5 |
| Houston: | 1.6 |
| Channelview: | 3.8 |
| Sugar Land: | 3.2 |
| Baytown: | 2.5 |
| Texas City: | 3.8 |
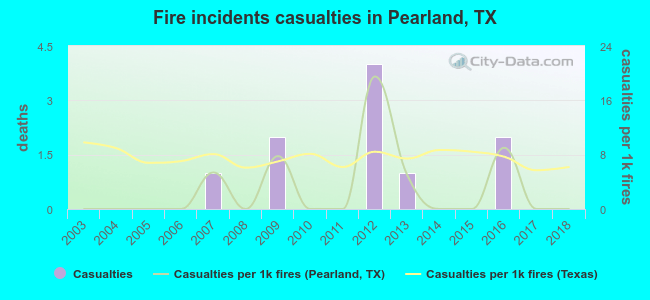 Based on the data from the years 2003 - 2018 the average number of fire-related casualties per year is 1. The highest number of casualties - 4 took place in 2012, and the lowest - 0 in 2003. The data has a constant trend.
The average number of casualties per 1,000 fires is 3. This indicator was the highest - 20 in 2012, and the lowest 0 in 2003. The trend for casualties per 1,000 fires is constant. Compared to the state value the number of injuries per 1,000 fire incidents is much lower.
Based on the data from the years 2003 - 2018 the average number of fire-related casualties per year is 1. The highest number of casualties - 4 took place in 2012, and the lowest - 0 in 2003. The data has a constant trend.
The average number of casualties per 1,000 fires is 3. This indicator was the highest - 20 in 2012, and the lowest 0 in 2003. The trend for casualties per 1,000 fires is constant. Compared to the state value the number of injuries per 1,000 fire incidents is much lower.Casualties per 1,000 incidents in Pearland, TX compared to nearest cities:
(Note: Based on data for all years, including only cities with at least 500 fire incidents)
| Pearland: | 3.1 |
| Manvel: | 0.0 |
| Friendswood: | 11.9 |
| Fresno: | 3.4 |
| Webster: | 10.9 |
| Pasadena: | 3.2 |
| Alvin: | 0.0 |
| League City: | 10.1 |
| Deer Park: | 9.2 |
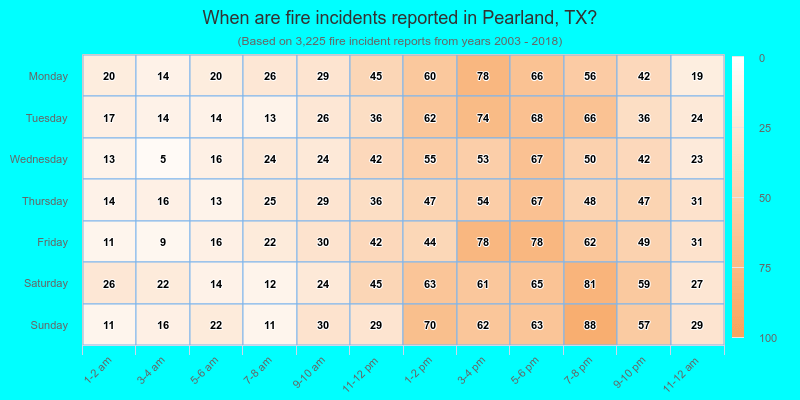
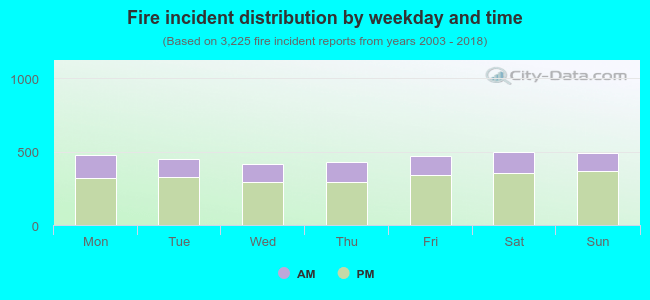 28.6% incidents where reported in the morning and 71.4% in the evening. The most fires (15.5%) took place on Saturday, and the least (12.8%) on Wednesday.
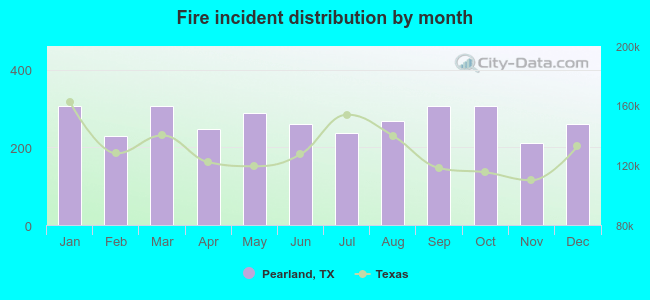 According to the 3,225 fire incidents from years 2003 - 2018 most fires (9.5%) took place during March, and the least (6.5%) in November.
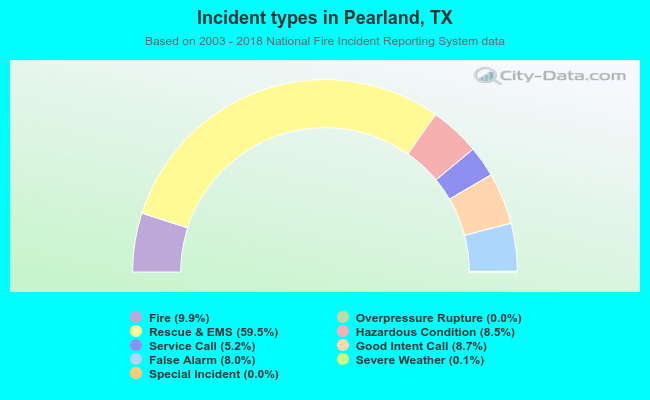 Out of all 32,506 cases reported during the years 2003 - 2018, the most belonged to the categories: Rescue & EMS (59.5%), Fire (9.9%), and Good Intent Call (8.7%).
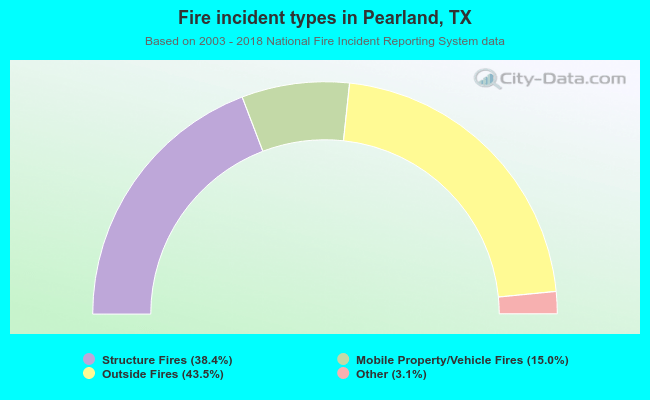 When looking into fire subcategories, the most reports belonged to: Outside Fires (43.5%), and Structure Fires (38.4%).