Haynesville: Fire Incidents, Louisiana (LA)
Where are fire incidents reported in Haynesville, LA
Something went wrong! Please refresh the page.
|
| |||||||||||||||||||||||||||||||||||||||||||||||||||||||||||||||||||||||||||||||||||||||||||||||||||||||||||||
| Other | 252 | |||||||||||||||||||||||||||||||||||||||||||||||||||||||||||||||||||||||||||||||||||||||||||||||||||||||||||||
2002 - 2018 National Fire Incident Reporting System (NFIRS) incidents
- Incident types reported to NFIRS in Haynesville, LA
- 61880.1%Fire
- 435.6%Hazardous Condition
- 415.3%Good Intent Call
- 314.0%Rescue & EMS
- 314.0%False Alarm
- 40.5%Service Call
- 20.3%Severe Weather
- 10.1%Overpressure Rupture
- 10.1%Special Incident
- Fire incident types reported to NFIRS in Haynesville, LA
- 30649.5%Outside Fires
- 22336.1%Structure Fires
- 569.1%Mobile Property/Vehicle Fires
- 335.3%Other
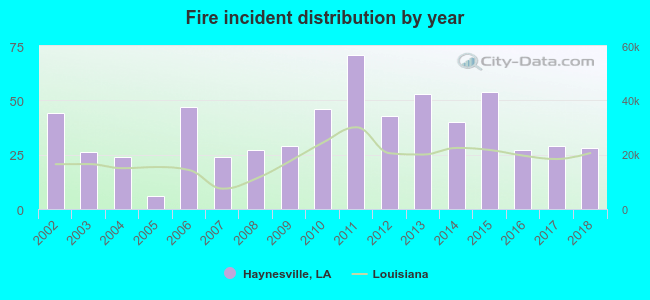 Based on the data from the years 2002 - 2018 the average number of fires per year is 36. The highest number of reported fire incidents - 71 took place in 2011, and the least - 6 in 2005. The data has a declining trend.
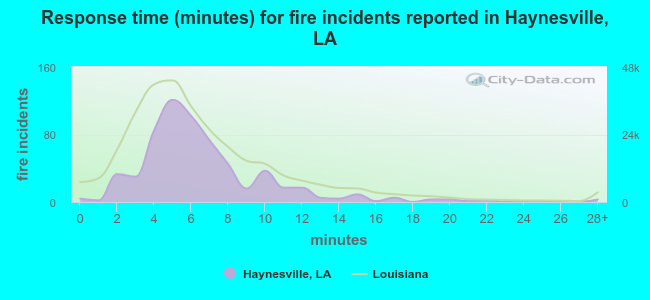 The median response time based on all reported fire incidents is 6 minutes. This is close to the state median value.
The median response time in Haynesville, LA compared to nearest cities:
(Note: Based on data for all years, including only cities with at least 500 fire incidents)
| Haynesville: | 6 minutes |
| Homer: | 7 minutes |
| Springhill: | 5 minutes |
| Magnolia: | 5 minutes |
| Minden: | 5 minutes |
| Waldo: | 9 minutes |
| El Dorado: | 4 minutes |
| Plain Dealing: | 9 minutes |
| Dubach: | 9 minutes |
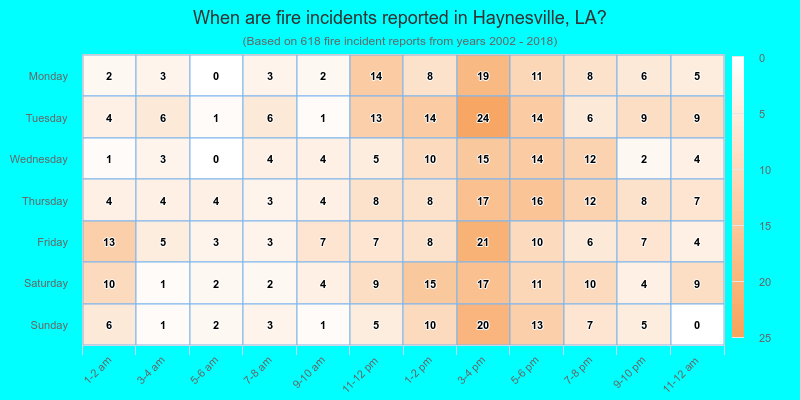
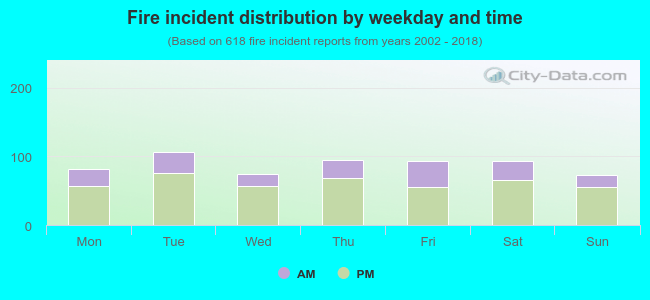 29.6% incidents where reported in the morning and 70.4% in the evening. The most fires (17.3%) took place on Tuesday, and the least (11.8%) on Sunday.
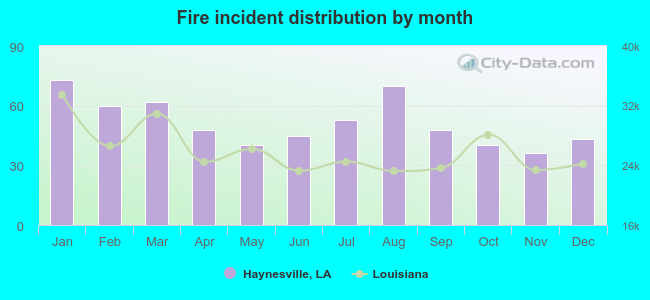 Based on the 618 incident reports from years 2002 - 2018 most fires (11.8%) took place during January, and the least (5.8%) in November.
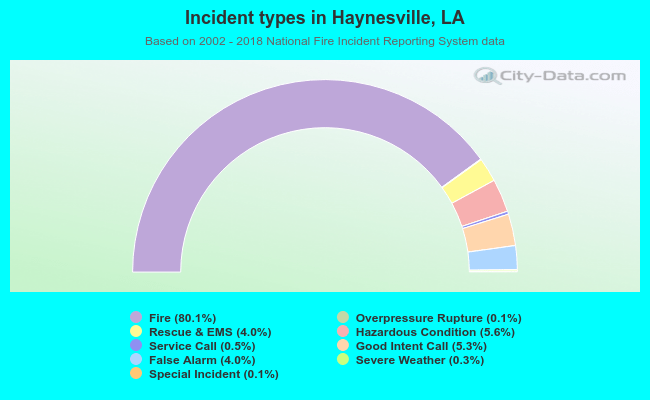 Out of all 772 cases reported during the years 2002 - 2018, the most belonged to the categories: Fire (80.1%), Hazardous Condition (5.6%), and Good Intent Call (5.3%).
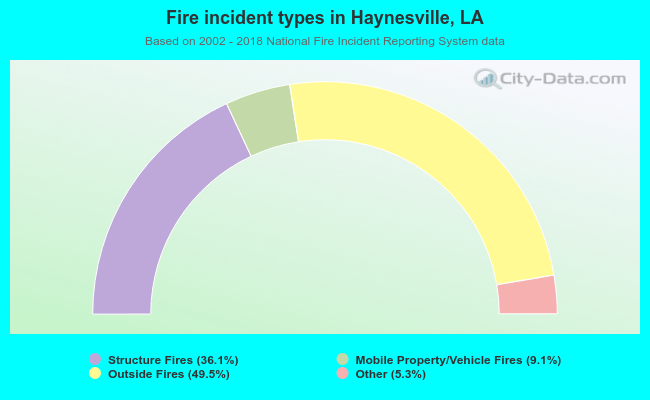 When looking into fire subcategories, the most incidents belonged to: Outside Fires (49.5%), and Structure Fires (36.1%).