Waldo: Fire Incidents, Arkansas (AR)
Where are fire incidents reported in Waldo, AR
Something went wrong! Please refresh the page.
|
| |||||||||||||||||||||||||||||||||||||||||||||||||||||||||||||||||||||||||||||||||||||||||||||||||||||||||||||
| Other | 5 | |||||||||||||||||||||||||||||||||||||||||||||||||||||||||||||||||||||||||||||||||||||||||||||||||||||||||||||
2002 - 2018 National Fire Incident Reporting System (NFIRS) incidents
- Incident types reported to NFIRS in Waldo, AR
- 62390.4%Fire
- 304.4%Good Intent Call
- 162.3%Hazardous Condition
- 81.2%Overpressure Rupture
- 60.9%False Alarm
- 50.7%Service Call
- 10.1%Rescue & EMS
- Fire incident types reported to NFIRS in Waldo, AR
- 32452.0%Outside Fires
- 20633.1%Structure Fires
- 7812.5%Mobile Property/Vehicle Fires
- 152.4%Other
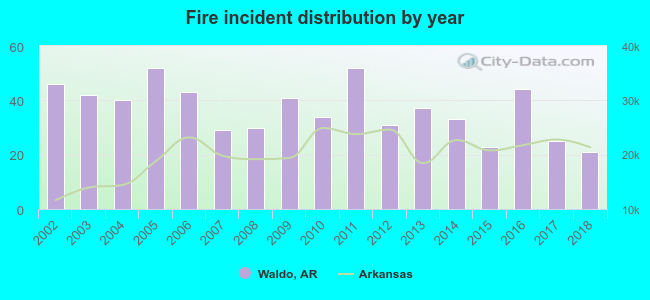 Based on the data from the years 2002 - 2018 the average number of fires per year is 37. The highest number of fire incidents - 52 took place in 2005, and the least - 21 in 2018. The data has a decreasing trend.
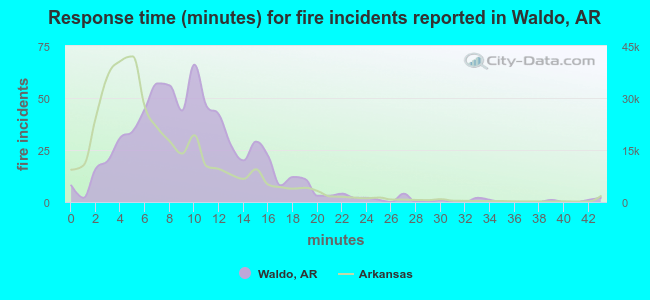 The median response time based on all reported fire incidents is 9 minutes. This is higher than the state median value.
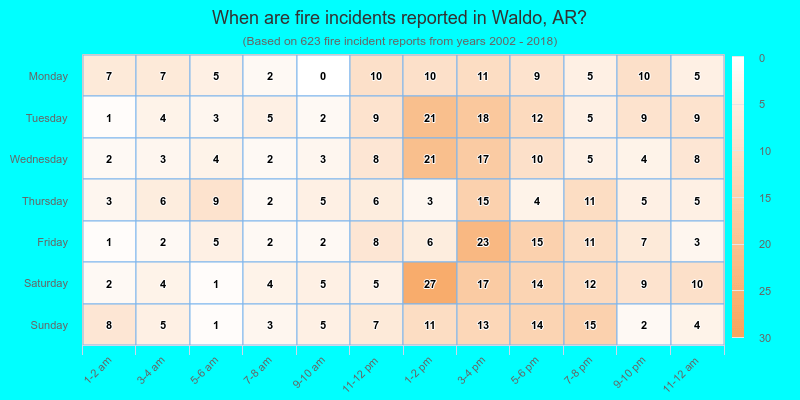
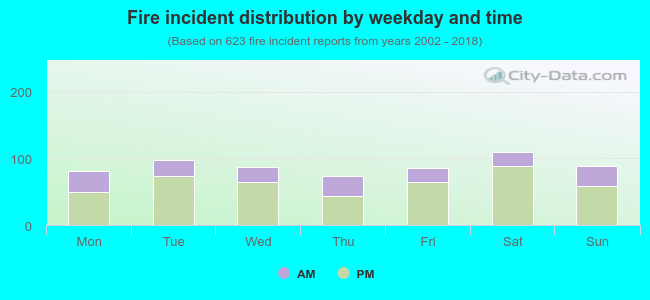 28.6% incidents where reported in the morning and 71.4% in the evening. The most fires (17.7%) took place on Saturday, and the least (11.9%) on Thursday.
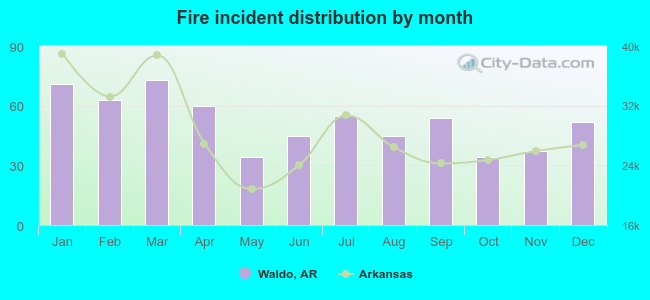 Based on the 623 fire incident reports from years 2002 - 2018 most fires (11.7%) took place during March, and the least (5.5%) in May.
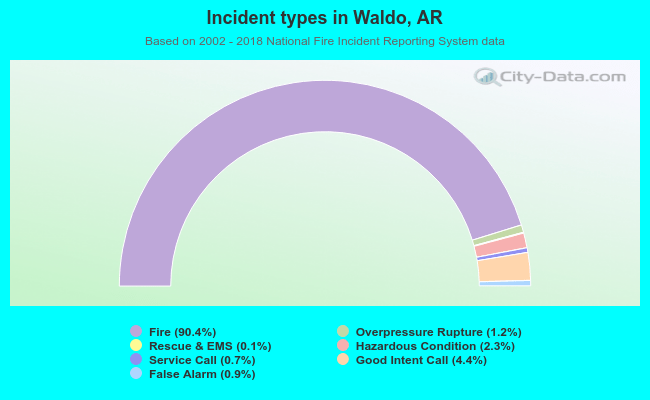 Out of all 689 cases reported during the years 2002 - 2018, the most belonged to the categories: Fire (90.4%), Good Intent Call (4.4%), and Hazardous Condition (2.3%).
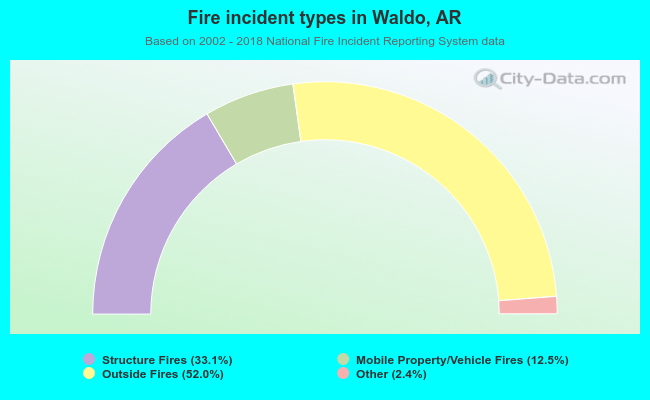 When looking into fire subcategories, the most incidents belonged to: Outside Fires (52.0%), and Structure Fires (33.1%).