Nashville: Fire Incidents, Arkansas (AR)
Where are fire incidents reported in Nashville, AR
Something went wrong! Please refresh the page.
|
| |||||||||||||||||||||||||||||||||||||||||||||||||||||||||||||||||||||||||||||||||||||||||||||||||||||||||||||
| Other | 375 | |||||||||||||||||||||||||||||||||||||||||||||||||||||||||||||||||||||||||||||||||||||||||||||||||||||||||||||
2002 - 2018 National Fire Incident Reporting System (NFIRS) incidents
- Incident types reported to NFIRS in Nashville, AR
- 1,25170.4%Fire
- 22212.5%Rescue & EMS
- 1267.1%Good Intent Call
- 1025.7%Hazardous Condition
- 331.9%False Alarm
- 281.6%Service Call
- 70.4%Overpressure Rupture
- 60.3%Severe Weather
- Fire incident types reported to NFIRS in Nashville, AR
- 60448.3%Outside Fires
- 45536.4%Structure Fires
- 18514.8%Mobile Property/Vehicle Fires
- 70.6%Other
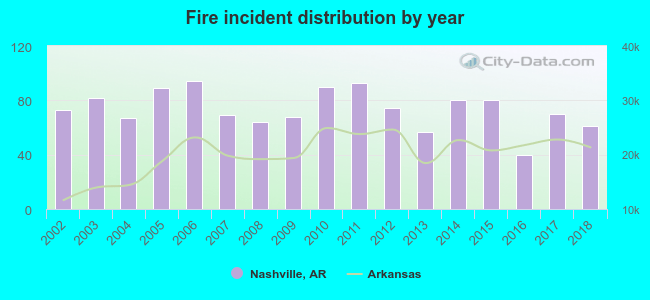 According to the data from the years 2002 - 2018 the average number of fire incidents per year is 74. The highest number of fire incidents - 94 took place in 2006, and the least - 40 in 2016. The data has a decreasing trend.
 The median response time based on all reported fire incidents is 7 minutes. This is about the same as the Arkansas median value.
 25.4% incidents where reported in the morning and 74.6% in the evening. The most fires (15.8%) took place on Monday, and the least (13.1%) on Friday.
 Based on the 1,251 reports from years 2002 - 2018 most fires (12.4%) took place during January, and the least (6.7%) in June.
 Out of all 1,776 cases reported during the years 2002 - 2018, the most belonged to the categories: Fire (70.4%), Rescue & EMS (12.5%), and Good Intent Call (7.1%).
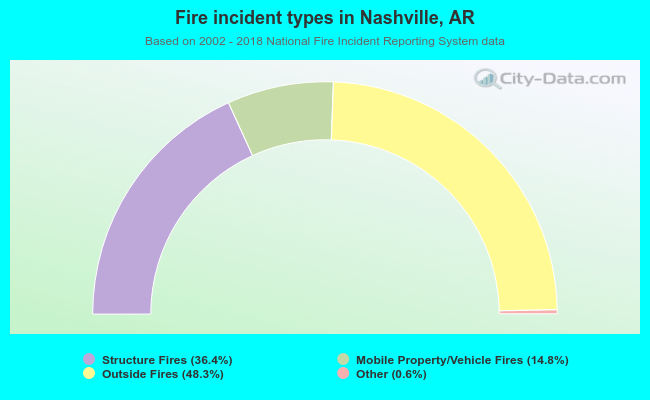 When looking into fire subcategories, the most reports belonged to: Outside Fires (48.3%), and Structure Fires (36.4%).