Homer: Fire Incidents, Louisiana (LA)
Where are fire incidents reported in Homer, LA
Something went wrong! Please refresh the page.
|
| |||||||||||||||||||||||||||||||||||||||||||||||||||||||||||||||||||||||||||||||||||||||||||||||||||||||||||||
| Other | 102 | |||||||||||||||||||||||||||||||||||||||||||||||||||||||||||||||||||||||||||||||||||||||||||||||||||||||||||||
2002 - 2018 National Fire Incident Reporting System (NFIRS) incidents
- Incident types reported to NFIRS in Homer, LA
- 59269.7%Fire
- 9110.7%Good Intent Call
- 688.0%Rescue & EMS
- 556.5%Hazardous Condition
- 364.2%False Alarm
- 50.6%Service Call
- 20.2%Overpressure Rupture
- Fire incident types reported to NFIRS in Homer, LA
- 28247.6%Outside Fires
- 20134.0%Structure Fires
- 7813.2%Mobile Property/Vehicle Fires
- 315.2%Other
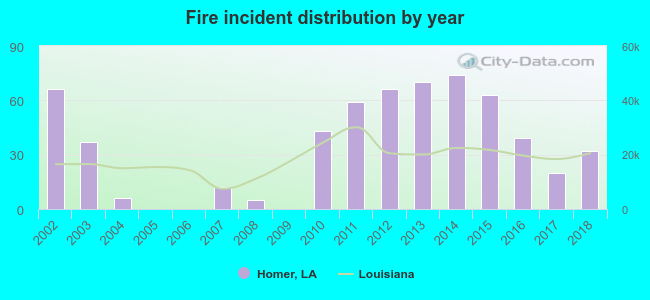 Based on the data from the years 2002 - 2018 the average number of fire incidents per year is 35. The highest number of reported fires - 74 took place in 2014, and the least - 0 in 2005. The data has a declining trend.
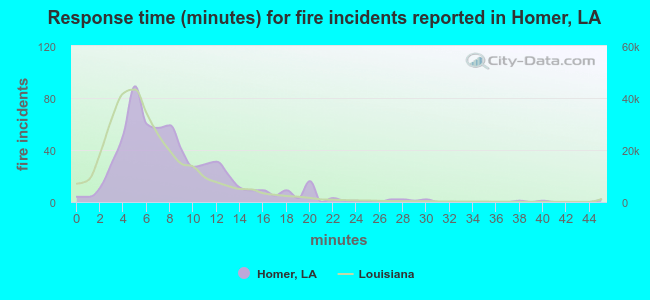 The median response time based on all reported fire incidents is 7 minutes. This is comparable to the state median value.
The median response time in Homer, LA compared to nearest cities:
(Note: Based on data for all years, including only cities with at least 500 fire incidents)
| Homer: | 7 minutes |
| Haynesville: | 6 minutes |
| Minden: | 5 minutes |
| Simsboro: | 9 minutes |
| Dubach: | 9 minutes |
| Springhill: | 5 minutes |
| Ruston: | 6 minutes |
| Haughton: | 6 minutes |
| Ringgold: | 8 minutes |
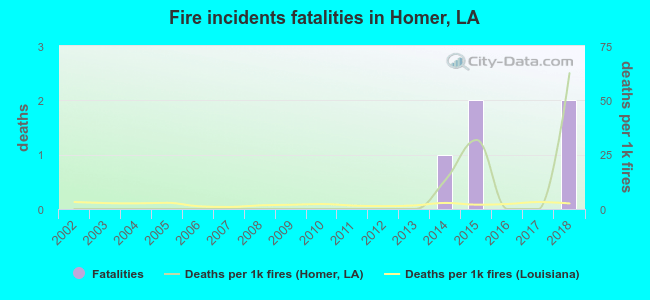 Based on the data from the years 2002 - 2018 the average number of fire-related fatalities per year is 0. The highest number of deaths - 2 took place in 2015, and the lowest - 0 in 2002. The data has an increasing trend.
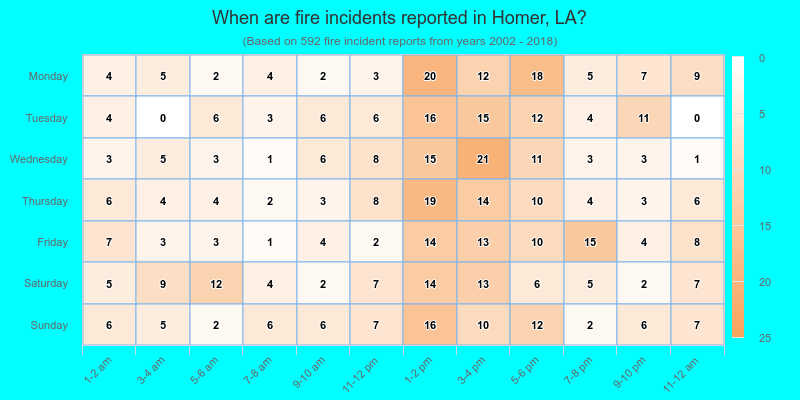
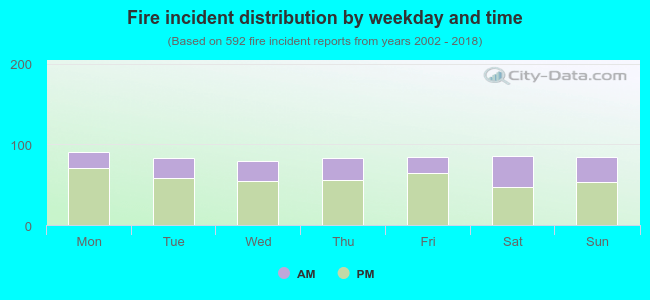 31.9% incidents where reported in the morning and 68.1% in the evening. The most fires (15.4%) took place on Monday, and the least (13.5%) on Wednesday.
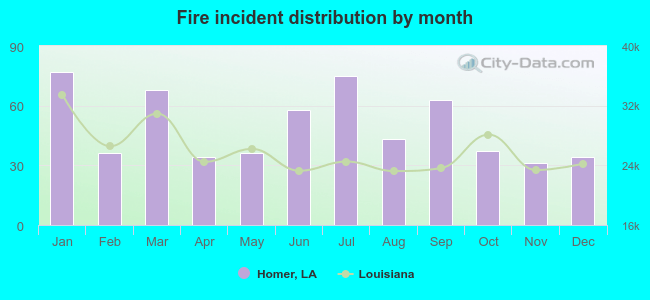 According to the 592 reports from years 2002 - 2018 most fires (13.0%) took place during January, and the least (5.2%) in November.
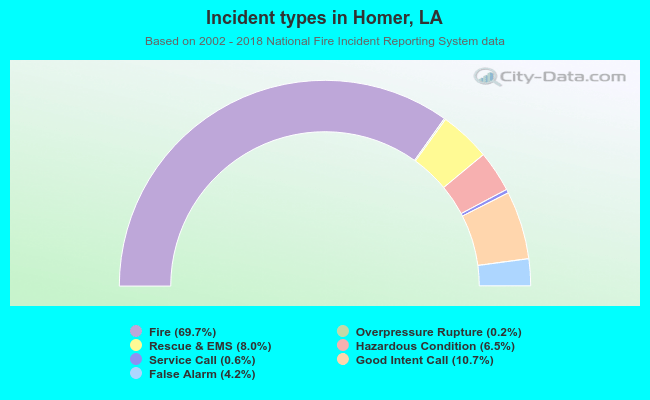 Out of all 849 cases reported during the years 2002 - 2018, the most belonged to the categories: Fire (69.7%), Good Intent Call (10.7%), and Rescue & EMS (8.0%).
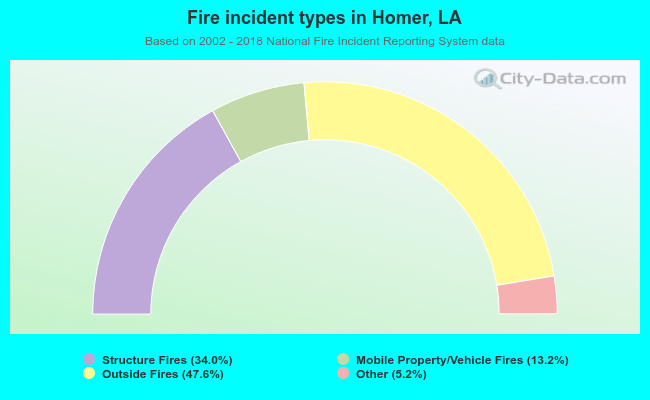 When looking into fire subcategories, the most incidents belonged to: Outside Fires (47.6%), and Structure Fires (34.0%).