Hartford: Fire Incidents, Michigan (MI)
Where are fire incidents reported in Hartford, MI
Something went wrong! Please refresh the page.
|
| |||||||||||||||||||||||||||||||||||||||||||||||||||||||||||||||||||||||||||||||||||||||||||||||||||||||||||||
| Other | 91 | |||||||||||||||||||||||||||||||||||||||||||||||||||||||||||||||||||||||||||||||||||||||||||||||||||||||||||||
2002 - 2018 National Fire Incident Reporting System (NFIRS) incidents
- Incident types reported to NFIRS in Hartford, MI
- 1,11049.5%Rescue & EMS
- 50522.5%Fire
- 24410.9%Hazardous Condition
- 2189.7%Good Intent Call
- 1215.4%Service Call
- 321.4%False Alarm
- 60.3%Severe Weather
- 30.1%Overpressure Rupture
- 30.1%Special Incident
- Fire incident types reported to NFIRS in Hartford, MI
- 22845.1%Structure Fires
- 15530.7%Outside Fires
- 8216.2%Mobile Property/Vehicle Fires
- 407.9%Other
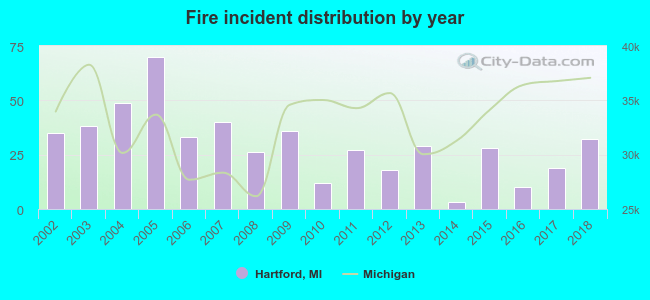 According to the data from the years 2002 - 2018 the average number of fires per year is 30. The highest number of reported fire incidents - 70 took place in 2005, and the least - 3 in 2014. The data has a decreasing trend.
 The median response time based on all reported fire incidents is 7 minutes. This is close to the state median value.
The median response time in Hartford, MI compared to nearest cities:
(Note: Based on data for all years, including only cities with at least 500 fire incidents)
| Hartford: | 7 minutes |
| Coloma: | 9 minutes |
| Bangor: | 8 minutes |
| Decatur: | 8 minutes |
| Paw Paw: | 5 minutes |
| South Haven: | 6 minutes |
| Dowagiac: | 8 minutes |
| Benton Harbor: | 4 minutes |
| Berrien Springs: | 10 minutes |
 Based on the reports from the years 2002 - 2018 the average number of fire-related yearly deaths is 0. The highest number of deaths - 1 took place in 2003, and the lowest - 0 in 2002. The data has a constant trend.
 37.6% incidents where reported in the morning and 62.4% in the evening. The most fires (17.0%) took place on Saturday, and the least (12.7%) on Tuesday.
 Based on the 505 incident reports from years 2002 - 2018 most fires (14.1%) took place during March, and the least (4.2%) in August.
 Out of all 2,242 cases reported during the years 2002 - 2018, the most belonged to the categories: Rescue & EMS (49.5%), Fire (22.5%), and Hazardous Condition (10.9%).
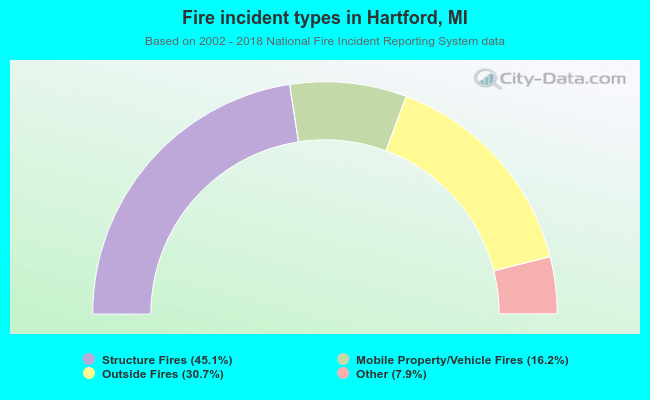 When looking into fire subcategories, the most reports belonged to: Structure Fires (45.1%), and Outside Fires (30.7%).