Decatur: Fire Incidents, Michigan (MI)
Where are fire incidents reported in Decatur, MI
Something went wrong! Please refresh the page.
|
| |||||||||||||||||||||||||||||||||||||||||||||||||||||||||||||||||||||||||||||||||||||||||||||||||||||||||||||
| Other | 96 | |||||||||||||||||||||||||||||||||||||||||||||||||||||||||||||||||||||||||||||||||||||||||||||||||||||||||||||
2002 - 2018 National Fire Incident Reporting System (NFIRS) incidents
- Incident types reported to NFIRS in Decatur, MI
- 54244.8%Fire
- 35829.6%Hazardous Condition
- 1119.2%Service Call
- 816.7%Good Intent Call
- 746.1%Rescue & EMS
- 373.1%False Alarm
- 40.3%Severe Weather
- 30.2%Overpressure Rupture
- Fire incident types reported to NFIRS in Decatur, MI
- 26448.7%Outside Fires
- 17432.1%Structure Fires
- 7714.2%Mobile Property/Vehicle Fires
- 275.0%Other
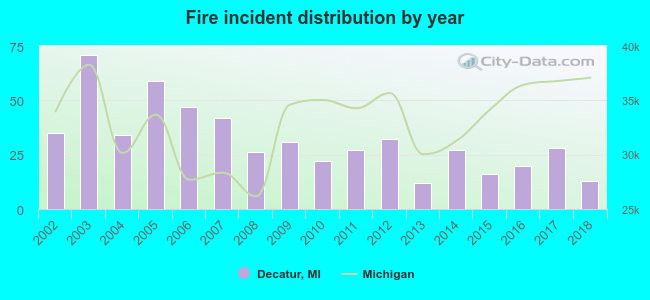 Based on the data from the years 2002 - 2018 the average number of fires per year is 32. The highest number of fire incidents - 71 took place in 2003, and the least - 12 in 2013. The data has a dropping trend.
 The median response time based on all reported fire incidents is 8 minutes. This is higher compared to the Michigan median value.
The median response time in Decatur, MI compared to nearest cities:
(Note: Based on data for all years, including only cities with at least 500 fire incidents)
| Decatur: | 8 minutes |
| Paw Paw: | 5 minutes |
| Dowagiac: | 8 minutes |
| Hartford: | 7 minutes |
| Cassopolis: | 12 minutes |
| Bangor: | 8 minutes |
| Coloma: | 9 minutes |
| Portage: | 5 minutes |
| Three Rivers: | 5 minutes |
 According to the data from the years 2002 - 2018 the average number of fire-related fatalities per year is 0. The highest number of reported deaths - 3 took place in 2007, and the lowest - 0 in 2002. The data has a constant trend.
 24.9% incidents where reported in the morning and 75.1% in the evening. The most fires (16.8%) took place on Thursday, and the least (12.7%) on Wednesday.
 Based on the 542 fire incidents from years 2002 - 2018 most fires (21.6%) took place during April, and the least (3.5%) in October.
 Out of all 1,211 cases reported during the years 2002 - 2018, the most belonged to the categories: Fire (44.8%), Hazardous Condition (29.6%), and Service Call (9.2%).
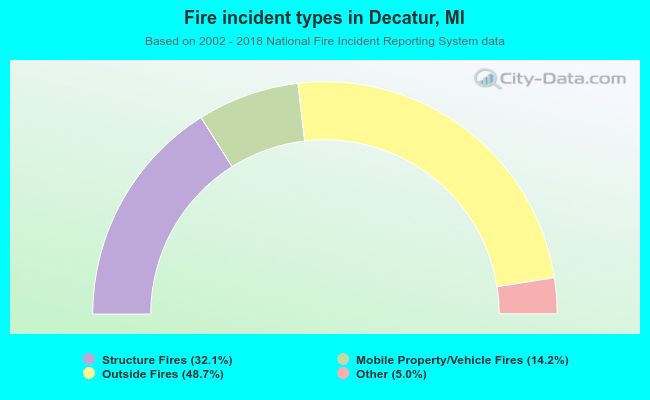 When looking into fire subcategories, the most reports belonged to: Outside Fires (48.7%), and Structure Fires (32.1%).