Coloma: Fire Incidents, Michigan (MI)
Where are fire incidents reported in Coloma, MI
Something went wrong! Please refresh the page.
|
| |||||||||||||||||||||||||||||||||||||||||||||||||||||||||||||||||||||||||||||||||||||||||||||||||||||||||||||
| Other | 20 | |||||||||||||||||||||||||||||||||||||||||||||||||||||||||||||||||||||||||||||||||||||||||||||||||||||||||||||
2002 - 2018 National Fire Incident Reporting System (NFIRS) incidents
- Incident types reported to NFIRS in Coloma, MI
- 59232.6%Hazardous Condition
- 55230.4%Fire
- 29716.3%Rescue & EMS
- 1578.6%Good Intent Call
- 995.4%Service Call
- 935.1%False Alarm
- 170.9%Special Incident
- 70.4%Severe Weather
- 30.2%Overpressure Rupture
- Fire incident types reported to NFIRS in Coloma, MI
- 24143.7%Structure Fires
- 20937.9%Outside Fires
- 8515.4%Mobile Property/Vehicle Fires
- 173.1%Other
 Based on the data from the years 2002 - 2018 the average number of fire incidents per year is 32. The highest number of fires - 67 took place in 2005, and the least - 6 in 2015. The data has a declining trend.
 The median response time based on all reported fire incidents is 9 minutes. This is higher than the Michigan median value.
The median response time in Coloma, MI compared to nearest cities:
(Note: Based on data for all years, including only cities with at least 500 fire incidents)
| Coloma: | 9 minutes |
| Hartford: | 7 minutes |
| Benton Harbor: | 4 minutes |
| Bangor: | 8 minutes |
| South Haven: | 6 minutes |
| Berrien Springs: | 10 minutes |
| Dowagiac: | 8 minutes |
| Decatur: | 8 minutes |
| Paw Paw: | 5 minutes |
 29.7% incidents where reported in the morning and 70.3% in the evening. The most fires (18.5%) took place on Monday, and the least (10.9%) on Tuesday.
 Based on the 552 incident reports from years 2002 - 2018 most fires (15.4%) took place during April, and the least (5.3%) in October.
 Out of all 1,817 cases reported during the years 2002 - 2018, the most belonged to the categories: Hazardous Condition (32.6%), Fire (30.4%), and Rescue & EMS (16.3%).
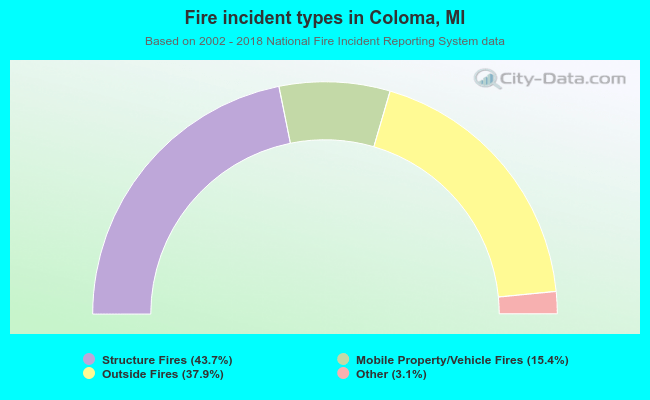 When looking into fire subcategories, the most incidents belonged to: Structure Fires (43.7%), and Outside Fires (37.9%).