Harper Woods: Fire Incidents, Michigan (MI)
Where are fire incidents reported in Harper Woods, MI
Something went wrong! Please refresh the page.
|
| |||||||||||||||||||||||||||||||||||||||||||||||||||||||||||||||||||||||||||||||||||||||||||||||||||||||||||||
2002 - 2018 National Fire Incident Reporting System (NFIRS) incidents
- Incident types reported to NFIRS in Harper Woods, MI
- 1,05647.6%Hazardous Condition
- 64329.0%Fire
- 2169.7%False Alarm
- 1024.6%Good Intent Call
- 743.3%Service Call
- 723.2%Rescue & EMS
- 542.4%Overpressure Rupture
- Fire incident types reported to NFIRS in Harper Woods, MI
- 41965.2%Structure Fires
- 10917.0%Mobile Property/Vehicle Fires
- 629.6%Outside Fires
- 538.2%Other
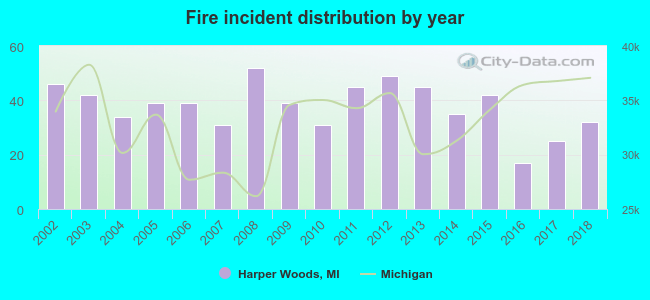 Based on the data from the years 2002 - 2018 the average number of fires per year is 38. The highest number of fire incidents - 52 took place in 2008, and the least - 17 in 2016. The data has a declining trend.
The average number of yearly fire incidents per 10k residents in Harper Woods, MI compared to nearest cities:
(Note: Based on data for the last 3 years, including only cities with population 5,000 and above)
| Harper Woods: | 17.7 |
| Grosse Pointe Woods: | 17.1 |
| Eastpointe: | 32.2 |
| Grosse Pointe Farms: | 14.0 |
| Grosse Pointe: | 5.7 |
| Grosse Pointe Park: | 13.0 |
| Roseville: | 29.2 |
| Center Line: | 78.6 |
| Warren: | 21.1 |
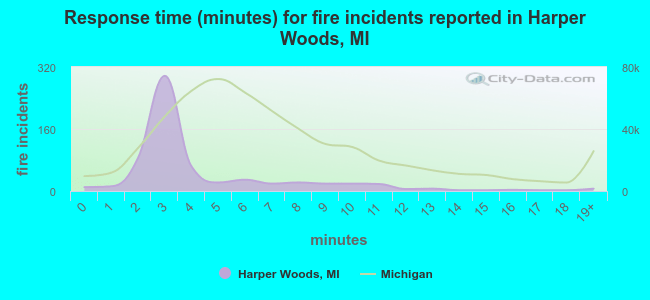 The median response time based on all reported fire incidents is 3 minutes. This is much lower than the Michigan median value.
The median response time in Harper Woods, MI compared to nearest cities:
(Note: Based on data for all years, including only cities with at least 500 fire incidents)
| Harper Woods: | 3 minutes |
| Eastpointe: | 4 minutes |
| St. Clair Shores: | 4 minutes |
| Roseville: | 4 minutes |
| Center Line: | 3 minutes |
| Warren: | 5 minutes |
| Hamtramck: | 3 minutes |
| Hazel Park: | 4 minutes |
| Highland Park: | 4 minutes |
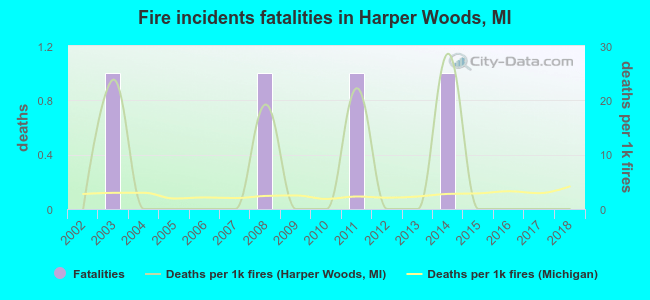 Based on the data from the years 2002 - 2018 the average number of fire-related fatalities per year is 0. The highest number of deaths - 1 took place in 2003, and the lowest - 0 in 2002. The data has a constant trend.
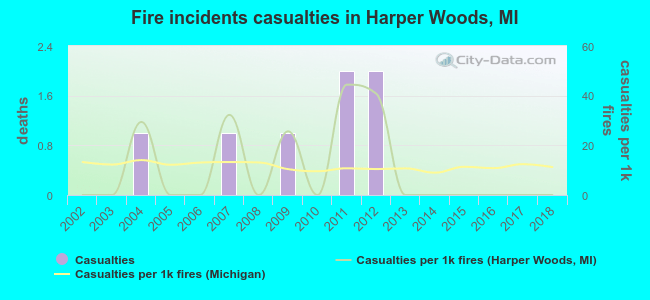 According to the data from the years 2002 - 2018 the average number of fire-related casualties per year is 0. The highest number of casualties - 2 took place in 2011, and the lowest - 0 in 2002. The data has a constant trend.
The average number of injuries per 1,000 fire incidents is 10. This indicator was the highest - 44 in 2011, and the lowest 0 in 2002. The trend for casualties per 1,000 incidents is constant. Compared to the state value the number of casualties per 1,000 fire incidents is about the same.
According to the data from the years 2002 - 2018 the average number of fire-related casualties per year is 0. The highest number of casualties - 2 took place in 2011, and the lowest - 0 in 2002. The data has a constant trend.
The average number of injuries per 1,000 fire incidents is 10. This indicator was the highest - 44 in 2011, and the lowest 0 in 2002. The trend for casualties per 1,000 incidents is constant. Compared to the state value the number of casualties per 1,000 fire incidents is about the same.Casualties per 1,000 incidents in Harper Woods, MI compared to nearest cities:
(Note: Based on data for all years, including only cities with at least 500 fire incidents)
| Harper Woods: | 10.9 |
| Eastpointe: | 29.7 |
| St. Clair Shores: | 16.8 |
| Roseville: | 12.8 |
| Center Line: | 31.9 |
| Warren: | 24.1 |
| Hamtramck: | 2.4 |
| Hazel Park: | 21.9 |
| Highland Park: | 3.4 |
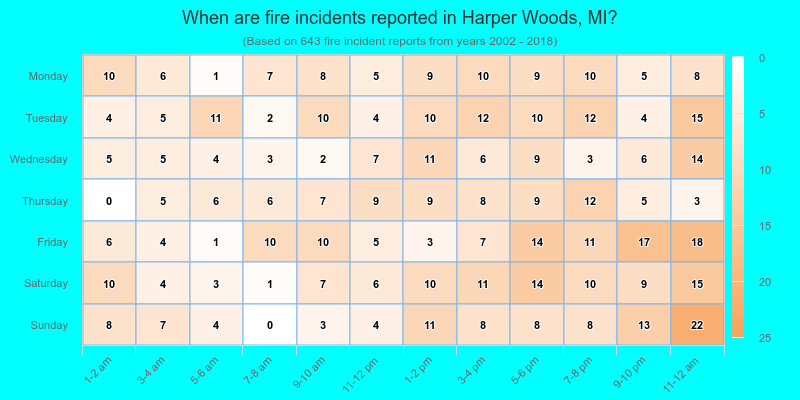
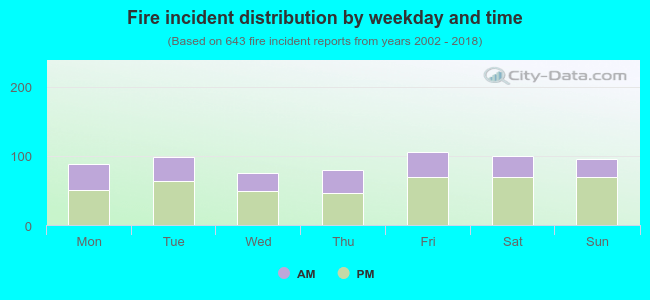 35.0% incidents where reported in the morning and 65.0% in the evening. The most fires (16.5%) took place on Friday, and the least (11.7%) on Wednesday.
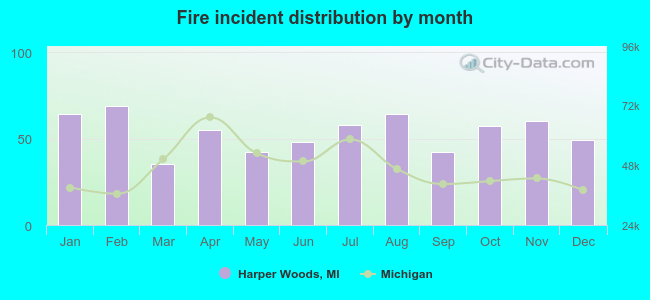 According to the 643 incident reports from years 2002 - 2018 most fires (10.7%) took place during February, and the least (5.4%) in March.
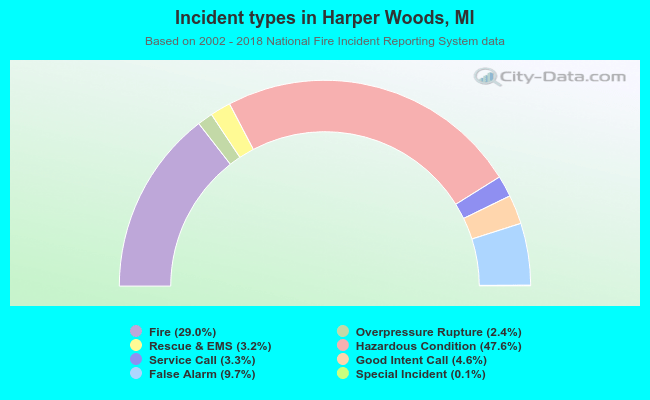 Out of all 2,219 cases reported during the years 2002 - 2018, the most belonged to the categories: Hazardous Condition (47.6%), Fire (29.0%), and False Alarm (9.7%).
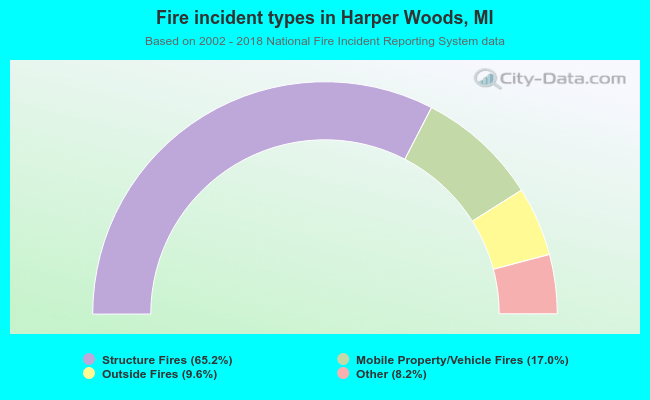 When looking into fire subcategories, the most incidents belonged to: Structure Fires (65.2%), and Mobile Property/Vehicle Fires (17.0%).