Eastpointe: Fire Incidents, Michigan (MI)
Where are fire incidents reported in Eastpointe, MI
Something went wrong! Please refresh the page.
| Fire incidents reported | |
|---|---|
| Sreet name | Count |
| NINE MILE | 204 |
| GRATIOT | 192 |
| TEN MILE | 82 |
| 9 MILE RD | 70 |
| KELLY | 70 |
| GRATIOT AVE | 54 |
| TOEPFER | 48 |
| FOREST | 44 |
| EIGHT MILE | 38 |
| JULIANA | 36 |
| COLLINSON | 34 |
| EGO | 34 |
| SPRENGER | 34 |
| BRITTANY | 30 |
| STRICKER | 30 |
| LEXINGTON | 28 |
| STEPHENS | 28 |
| 10 MILE RD | 26 |
| BEACONSFIELD | 26 |
| LINCOLN | 26 |
| TUSCANY | 26 |
| BEECHWOOD | 24 |
| BELL | 24 |
| KELLY RD | 24 |
| LAMBRECHT | 24 |
| VERONICA | 24 |
| CUSHING | 22 |
| PIPER | 22 |
| SHAKESPEARE | 22 |
| WILMOT | 22 |
2002 - 2018 National Fire Incident Reporting System (NFIRS) incidents
- Incident types reported to NFIRS in Eastpointe, MI
- 10,39762.2%Rescue & EMS
- 1,81310.9%Hazardous Condition
- 1,4128.5%Service Call
- 1,3468.1%Fire
- 9065.4%Good Intent Call
- 6664.0%False Alarm
- 1430.9%Special Incident
- 200.1%Overpressure Rupture
- Fire incident types reported to NFIRS in Eastpointe, MI
- 63146.9%Structure Fires
- 34625.7%Outside Fires
- 20615.3%Mobile Property/Vehicle Fires
- 16312.1%Other
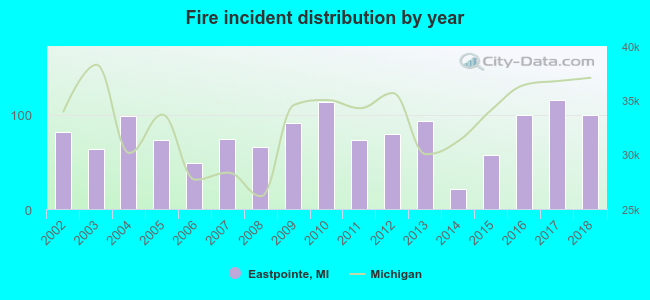 Based on the data from the years 2002 - 2018 the average number of fires per year is 79. The highest number of reported fire incidents - 115 took place in 2017, and the least - 21 in 2014. The data has an increasing trend.
The average number of yearly fire incidents per 10k residents in Eastpointe, MI compared to nearest cities:
(Note: Based on data for the last 3 years, including only cities with population 5,000 and above)
| Eastpointe: | 32.2 |
| Harper Woods: | 17.7 |
| Roseville: | 29.2 |
| Grosse Pointe Woods: | 17.1 |
| Center Line: | 78.6 |
| Warren: | 21.1 |
| Grosse Pointe Farms: | 14.0 |
| Fraser: | 15.7 |
| Grosse Pointe: | 5.7 |
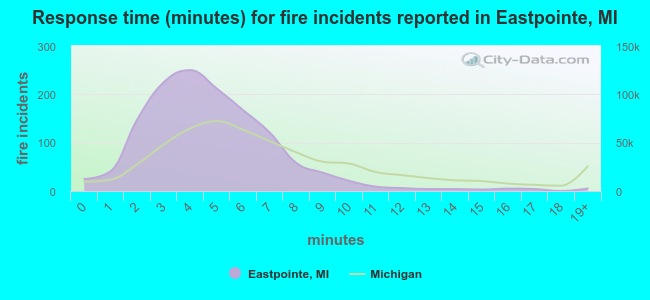 The median response time based on all reported fire incidents is 4 minutes. This is lower compared to the state median value.
The median response time in Eastpointe, MI compared to nearest cities:
(Note: Based on data for all years, including only cities with at least 500 fire incidents)
| Eastpointe: | 4 minutes |
| Harper Woods: | 3 minutes |
| Roseville: | 4 minutes |
| St. Clair Shores: | 4 minutes |
| Center Line: | 3 minutes |
| Warren: | 5 minutes |
| Hamtramck: | 3 minutes |
| Hazel Park: | 4 minutes |
| Madison Heights: | 3 minutes |
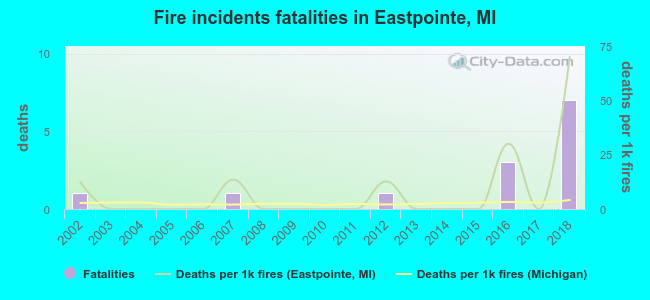 Based on the reports from the years 2002 - 2018 the average number of fire-related yearly deaths is 1. The highest number of deaths - 7 took place in 2018, and the lowest - 0 in 2003. The data has an increasing trend.
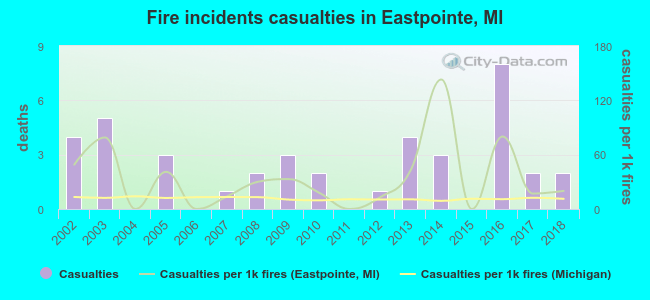 Based on the reports from the years 2002 - 2018 the average number of fire-related yearly casualties is 2. The highest number of injuries - 8 took place in 2016, and the lowest - 0 in 2004. The data has a declining trend.
The average number of injuries per 1,000 fire incidents is 34. This indicator was the highest - 143 in 2014, and the lowest 0 in 2004. The trend for casualties per 1,000 incidents is declining. Compared to the state value the number of injuries per 1,000 fire incidents is much higher.
Based on the reports from the years 2002 - 2018 the average number of fire-related yearly casualties is 2. The highest number of injuries - 8 took place in 2016, and the lowest - 0 in 2004. The data has a declining trend.
The average number of injuries per 1,000 fire incidents is 34. This indicator was the highest - 143 in 2014, and the lowest 0 in 2004. The trend for casualties per 1,000 incidents is declining. Compared to the state value the number of injuries per 1,000 fire incidents is much higher.Casualties per 1,000 incidents in Eastpointe, MI compared to nearest cities:
(Note: Based on data for all years, including only cities with at least 500 fire incidents)
| Eastpointe: | 29.7 |
| Harper Woods: | 10.9 |
| Roseville: | 12.8 |
| St. Clair Shores: | 16.8 |
| Center Line: | 31.9 |
| Warren: | 24.1 |
| Hamtramck: | 2.4 |
| Hazel Park: | 21.9 |
| Madison Heights: | 10.5 |
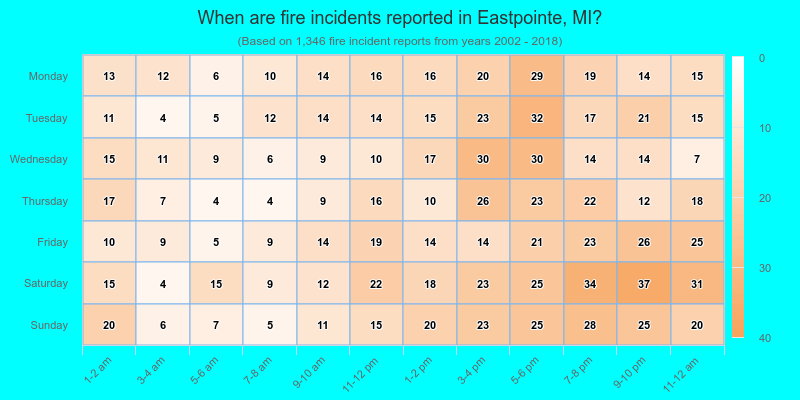
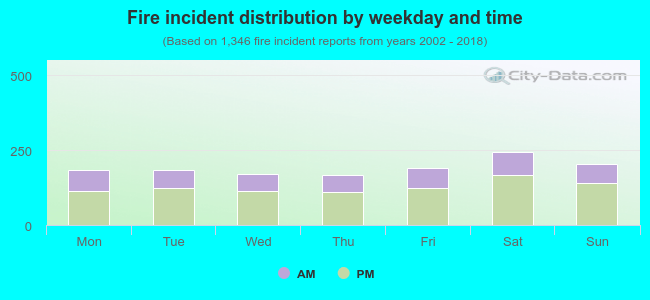 33.8% incidents where reported in the morning and 66.2% in the evening. The most fires (18.2%) took place on Saturday, and the least (12.5%) on Thursday.
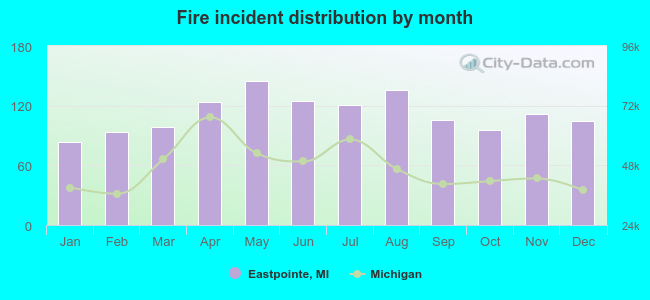 Based on the 1,346 reports from years 2002 - 2018 most fires (10.8%) took place during May, and the least (6.2%) in January.
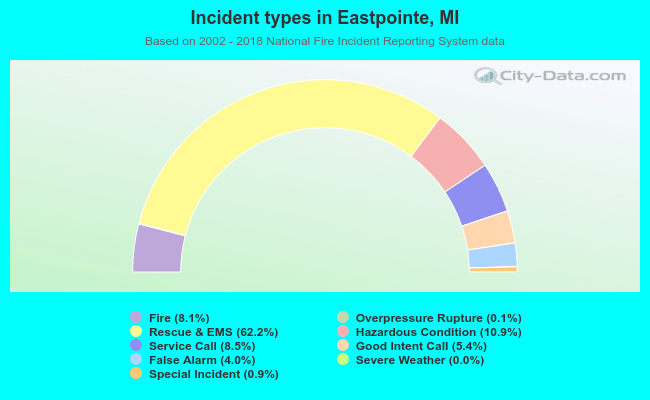 Out of all 16,704 cases reported during the years 2002 - 2018, the most belonged to the categories: Rescue & EMS (62.2%), Hazardous Condition (10.9%), and Service Call (8.5%).
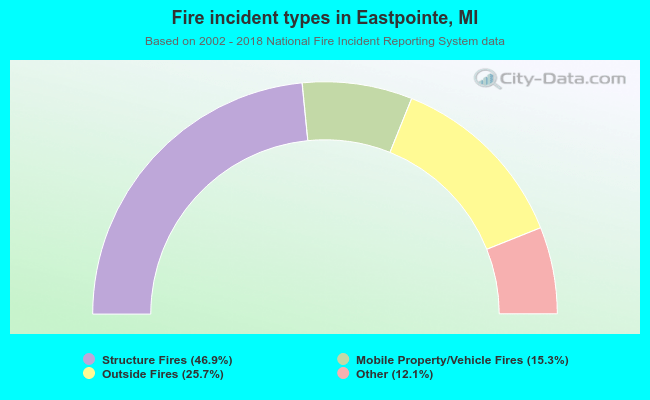 When looking into fire subcategories, the most incidents belonged to: Structure Fires (46.9%), and Outside Fires (25.7%).