Hamtramck: Fire Incidents, Michigan (MI)
Where are fire incidents reported in Hamtramck, MI
Something went wrong! Please refresh the page.
| Fire incidents reported | |
|---|---|
| Sreet name | Count |
| HOLBROOK ST | 436 |
| CANIFF ST | 316 |
| JOS. CAMPAU ST | 294 |
| CONANT | 178 |
| BELMONT ST | 164 |
| LUMPKIN ST | 132 |
| TROWBRIDGE ST | 124 |
| JOS CAMPAU ST | 108 |
| CHAREST ST | 80 |
| YEMANS ST | 80 |
| DANFORTH ST | 78 |
| EVALINE ST | 74 |
| MCDOUGALL ST | 70 |
| MITCHELL ST | 70 |
| EDWIN ST | 66 |
| GOODSON ST | 64 |
| FABER ST | 62 |
| GALLAGHER ST | 62 |
| MORAN ST | 62 |
| NAGEL ST | 60 |
| ROOSEVELT ST | 56 |
| JACOB ST | 50 |
| NORWALK ST | 50 |
| DEQUINDRE ST | 46 |
| DYAR ST | 46 |
| HOLMES ST | 44 |
| ST. AUBIN ST | 42 |
| KLINGER ST | 40 |
| OLIVER ST | 40 |
| CARPENTER ST | 38 |
2002 - 2018 National Fire Incident Reporting System (NFIRS) incidents
- Incident types reported to NFIRS in Hamtramck, MI
- 4,28546.9%Rescue & EMS
- 2,09722.9%Fire
- 1,07811.8%Hazardous Condition
- 6737.4%Service Call
- 5796.3%False Alarm
- 3403.7%Good Intent Call
- 410.4%Special Incident
- 250.3%Overpressure Rupture
- 240.3%Severe Weather
- Fire incident types reported to NFIRS in Hamtramck, MI
- 1,15254.9%Structure Fires
- 51824.7%Outside Fires
- 28113.4%Mobile Property/Vehicle Fires
- 1467.0%Other
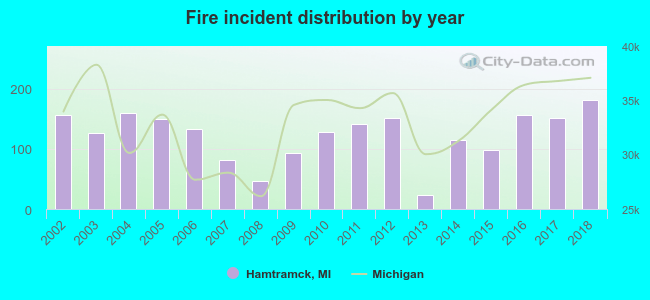 According to the data from the years 2002 - 2018 the average number of fires per year is 123. The highest number of reported fires - 181 took place in 2018, and the least - 24 in 2013. The data has a growing trend.
The average number of yearly fire incidents per 10k residents in Hamtramck, MI compared to nearest cities:
(Note: Based on data for the last 3 years, including only cities with population 5,000 and above)
| Hamtramck: | 73.8 |
| Highland Park: | 197.9 |
| Detroit: | 91.5 |
| Hazel Park: | 35.3 |
| Ferndale: | 32.1 |
| Center Line: | 78.6 |
| Grosse Pointe Park: | 13.0 |
| Warren: | 21.1 |
| Harper Woods: | 17.7 |
 The median response time based on all reported fire incidents is 3 minutes. This is much lower than the state median value.
The median response time in Hamtramck, MI compared to nearest cities:
(Note: Based on data for all years, including only cities with at least 500 fire incidents)
| Hamtramck: | 3 minutes |
| Highland Park: | 4 minutes |
| Detroit: | 6 minutes |
| Hazel Park: | 4 minutes |
| Ferndale: | 4 minutes |
| Center Line: | 3 minutes |
| Warren: | 5 minutes |
| Harper Woods: | 3 minutes |
| Eastpointe: | 4 minutes |
 According to the reports from the years 2002 - 2018 the average number of fire-related fatalities per year is 0. The highest number of deaths - 4 took place in 2015, and the lowest - 0 in 2002. The data has a constant trend.
 Based on the data from the years 2002 - 2018 the average number of fire-related casualties per year is 0. The highest number of reported injuries - 2 took place in 2007, and the lowest - 0 in 2002. The data has a constant trend.
The average number of injuries per 1,000 fires is 3. This indicator was the highest - 24 in 2007, and the lowest 0 in 2002. The trend for injuries per 1,000 incidents is constant. Compared to the state value the number of injuries per 1,000 fires is much lower.
Based on the data from the years 2002 - 2018 the average number of fire-related casualties per year is 0. The highest number of reported injuries - 2 took place in 2007, and the lowest - 0 in 2002. The data has a constant trend.
The average number of injuries per 1,000 fires is 3. This indicator was the highest - 24 in 2007, and the lowest 0 in 2002. The trend for injuries per 1,000 incidents is constant. Compared to the state value the number of injuries per 1,000 fires is much lower.Casualties per 1,000 incidents in Hamtramck, MI compared to nearest cities:
(Note: Based on data for all years, including only cities with at least 500 fire incidents)
| Hamtramck: | 2.4 |
| Highland Park: | 3.4 |
| Detroit: | 6.5 |
| Hazel Park: | 21.9 |
| Ferndale: | 33.1 |
| Center Line: | 31.9 |
| Warren: | 24.1 |
| Harper Woods: | 10.9 |
| Eastpointe: | 29.7 |
 36.7% incidents where reported in the morning and 63.3% in the evening. The most fires (16.1%) took place on Sunday, and the least (13.3%) on Wednesday.
 Based on the 2,097 fire incident reports from years 2002 - 2018 most fires (12.4%) took place during June, and the least (5.1%) in February.
 Out of all 9,142 cases reported during the years 2002 - 2018, the most belonged to the categories: Rescue & EMS (46.9%), Fire (22.9%), and Hazardous Condition (11.8%).
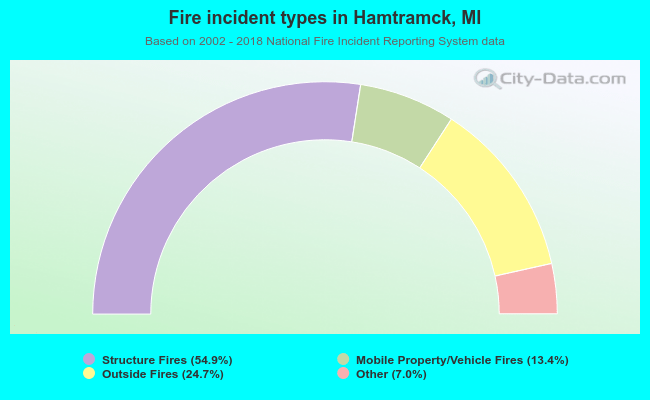 When looking into fire subcategories, the most incidents belonged to: Structure Fires (54.9%), and Outside Fires (24.7%).