Dallas: Fire Incidents, Texas (TX)
Where are fire incidents reported in Dallas, TX
Something went wrong! Please refresh the page.
| Fire incidents reported | |
|---|---|
| Sreet name | Count |
| FOREST LN | 570 |
| LEDBETTER DR | 444 |
| BUCKNER BLVD | 432 |
| NORTHWEST HWY | 428 |
| AUDELIA RD | 382 |
| SKILLMAN ST | 364 |
| L B J FWY | 360 |
| FERGUSON RD | 350 |
| CENTRAL EXPY | 298 |
| KIEST BLVD | 288 |
| PRESTON RD | 278 |
| OVERTON RD | 276 |
| R L THORNTON FWY | 276 |
| COCKRELL HILL RD | 272 |
| WESTMORELAND RD | 268 |
| ILLINOIS AVE | 264 |
| PARK LN | 262 |
| LANCASTER RD | 256 |
| ROYAL LN | 254 |
| HARRY HINES BLVD | 248 |
| BONNIE VIEW RD | 242 |
| JIM MILLER RD | 232 |
| BICKERS ST | 228 |
| CAMP WISDOM RD | 224 |
| HAMPTON RD | 222 |
| SCYENE RD | 212 |
| JOHN WEST RD | 206 |
| STEMMONS FWY | 202 |
| ST AUGUSTINE DR | 198 |
| WALNUT ST | 198 |
| Other | 22,304 |
2005 - 2018 National Fire Incident Reporting System (NFIRS) incidents
- Incident types reported to NFIRS in Dallas, TX
- 281,37754.8%Rescue & EMS
- 60,71911.8%Good Intent Call
- 58,89811.5%Hazardous Condition
- 46,4339.0%Service Call
- 33,0066.4%False Alarm
- 31,0386.0%Fire
- 1,7550.3%Special Incident
- Fire incident types reported to NFIRS in Dallas, TX
- 14,44046.5%Outside Fires
- 9,44330.4%Structure Fires
- 6,08419.6%Mobile Property/Vehicle Fires
- 1,0713.5%Other
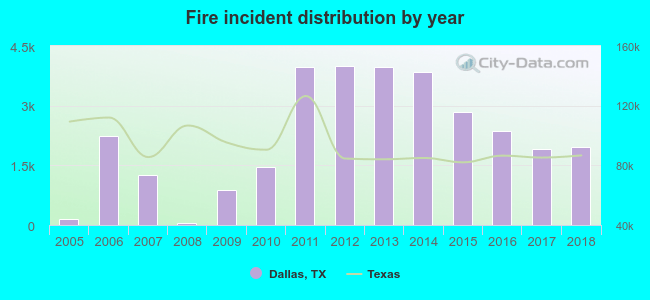 Based on the data from the years 2005 - 2018 the average number of fire incidents per year is 2,209. The highest number of reported fires - 3,993 took place in 2012, and the least - 57 in 2008. The data has a growing trend.
The average number of yearly fire incidents per 10k residents in Dallas, TX compared to nearest cities:
(Note: Based on data for the last 3 years, including only cities with population 5,000 and above)
| Dallas: | 16.3 |
| Highland Park: | 13.0 |
| University Park: | 15.3 |
| Mesquite: | 31.4 |
| Farmers Branch: | 29.3 |
| Irving: | 21.8 |
| Addison: | 50.9 |
| Balch Springs: | 39.0 |
| Garland: | 25.0 |
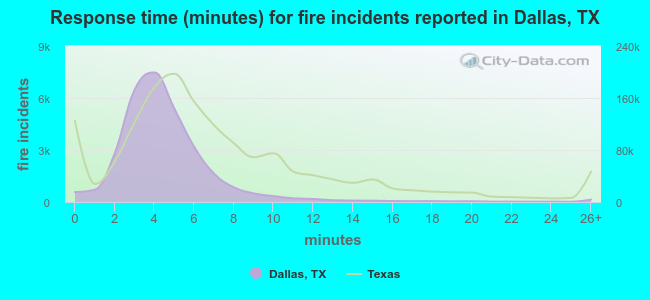 The median response time based on all reported fire incidents is 4 minutes. This is lower than the state median value.
The median response time in Dallas, TX compared to nearest cities:
(Note: Based on data for all years, including only cities with at least 500 fire incidents)
| Dallas: | 4 minutes |
| University Park: | 5 minutes |
| Mesquite: | 5 minutes |
| Farmers Branch: | 5 minutes |
| Irving: | 5 minutes |
| Addison: | 5 minutes |
| Balch Springs: | 5 minutes |
| Garland: | 5 minutes |
| Hutchins: | 6 minutes |
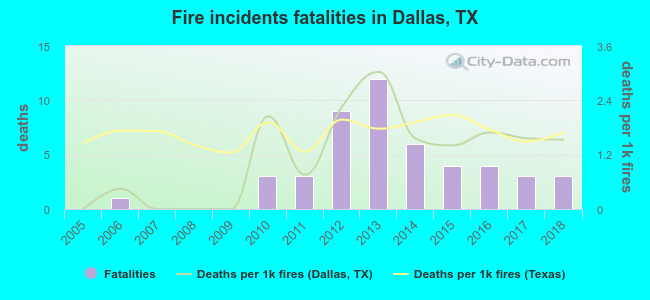 According to the reports from the years 2005 - 2018 the average number of fire-related yearly deaths is 3. The highest number of reported deaths - 12 took place in 2013, and the lowest - 0 in 2005. The data has a rising trend.
The average number of deaths per 1,000 fire incidents is 1. This indicator was the highest - 3 in 2013, and the lowest 0 in 2005. The trend for deaths per 1,000 incidents is increasing. Compared to the state value the number of fatalities per 1,000 fire incidents is about the same.
According to the reports from the years 2005 - 2018 the average number of fire-related yearly deaths is 3. The highest number of reported deaths - 12 took place in 2013, and the lowest - 0 in 2005. The data has a rising trend.
The average number of deaths per 1,000 fire incidents is 1. This indicator was the highest - 3 in 2013, and the lowest 0 in 2005. The trend for deaths per 1,000 incidents is increasing. Compared to the state value the number of fatalities per 1,000 fire incidents is about the same.Deaths per 1,000 incidents in Dallas, TX compared to nearest cities:
(Note: Based on data for all years, including only cities with at least 2,500 fire incidents)
| Dallas: | 1.5 |
| Mesquite: | 0.8 |
| Irving: | 0.7 |
| Garland: | 2.2 |
| Richardson: | 1.5 |
| Duncanville: | 0.8 |
| Lancaster: | 1.9 |
| DeSoto: | 0.6 |
| Carrollton: | 1.7 |
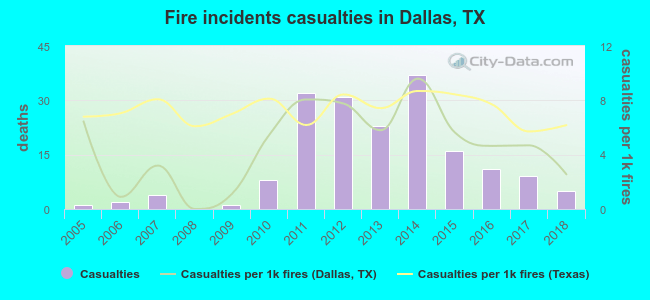 According to the reports from the years 2005 - 2018 the average number of fire-related yearly casualties is 13. The highest number of casualties - 37 took place in 2014, and the lowest - 0 in 2008. The data has a growing trend.
The average number of injuries per 1,000 fire incidents is 5. This indicator was the highest - 10 in 2014, and the lowest 0 in 2008. The trend for casualties per 1,000 fire incidents is dropping. Compared to the state value the number of injuries per 1,000 fires is lower.
According to the reports from the years 2005 - 2018 the average number of fire-related yearly casualties is 13. The highest number of casualties - 37 took place in 2014, and the lowest - 0 in 2008. The data has a growing trend.
The average number of injuries per 1,000 fire incidents is 5. This indicator was the highest - 10 in 2014, and the lowest 0 in 2008. The trend for casualties per 1,000 fire incidents is dropping. Compared to the state value the number of injuries per 1,000 fires is lower.Casualties per 1,000 incidents in Dallas, TX compared to nearest cities:
(Note: Based on data for all years, including only cities with at least 500 fire incidents)
| Dallas: | 5.8 |
| University Park: | 5.9 |
| Mesquite: | 12.0 |
| Farmers Branch: | 14.7 |
| Irving: | 7.0 |
| Addison: | 4.6 |
| Balch Springs: | 4.5 |
| Garland: | 5.4 |
| Hutchins: | 9.0 |
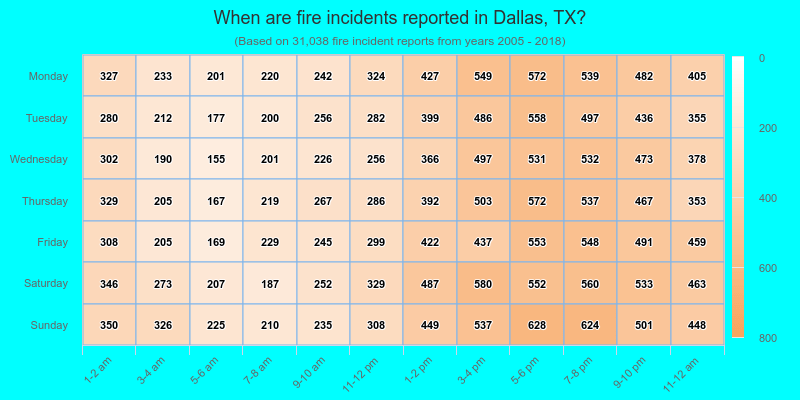
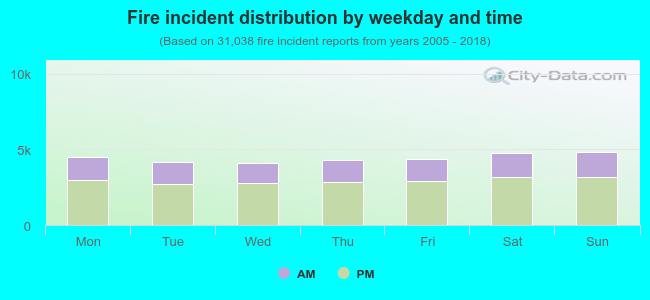 33.7% incidents where reported in the morning and 66.3% in the evening. The most fires (15.6%) took place on Sunday, and the least (13.2%) on Wednesday.
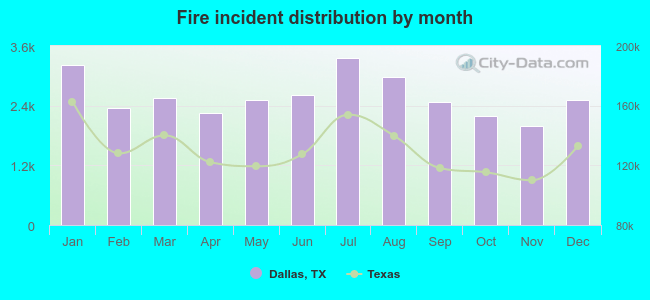 According to the 31,038 fire incidents from years 2005 - 2018 most fires (10.8%) took place during July, and the least (6.4%) in November.
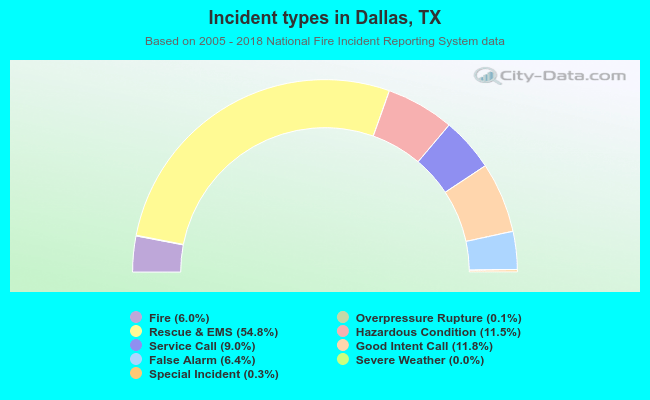 Out of all 513,832 cases reported during the years 2005 - 2018, the most belonged to the categories: Rescue & EMS (54.8%), Good Intent Call (11.8%), and Hazardous Condition (11.5%).
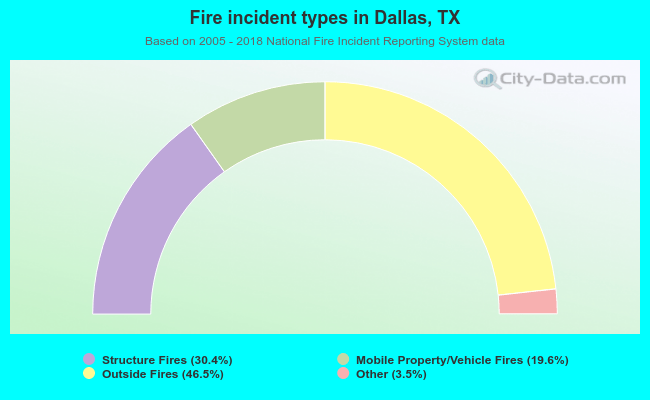 When looking into fire subcategories, the most incidents belonged to: Outside Fires (46.5%), and Structure Fires (30.4%).