Carrollton: Fire Incidents, Texas (TX)
Where are fire incidents reported in Carrollton, TX
Something went wrong! Please refresh the page.
| Fire incidents reported | |
|---|---|
| Sreet name | Count |
| JOSEY LN | 596 |
| OLD DENTON RD | 278 |
| TRINITY MILLS RD | 268 |
| FRANKFORD RD | 246 |
| COUNTRY SQUARE DR | 242 |
| BELT LINE RD | 218 |
| CROSBY RD | 164 |
| MARSH LN | 162 |
| HEBRON PKWY | 142 |
| MAC ARTHUR DR | 140 |
| PETERS COLONY RD | 134 |
| MIDWAY RD | 120 |
| KELLER SPRINGS RD | 114 |
| IH 35E | 102 |
| METROCREST DR | 92 |
| GUERRERO DR | 86 |
| SANDY LAKE RD | 80 |
| HUTTON DR | 72 |
| TARPLEY RD | 66 |
| IH 35E HWY | 62 |
| KELLY BLVD | 62 |
| 35E N SB | 50 |
| PARK AVE | 50 |
| ROSEMEADE PKWY | 50 |
| DENTON DR | 48 |
| LUNA RD | 48 |
| WALNUT PLAZA | 48 |
| HEBRON | 46 |
| PERRY RD | 46 |
| BRANCH HOLLOW DR | 44 |
| Other | 808 |
2002 - 2018 National Fire Incident Reporting System (NFIRS) incidents
- Incident types reported to NFIRS in Carrollton, TX
- 37,73759.2%Rescue & EMS
- 6,3019.9%Hazardous Condition
- 5,4058.5%Good Intent Call
- 4,7467.4%Service Call
- 4,7447.4%False Alarm
- 4,6847.3%Fire
- 780.1%Overpressure Rupture
- Fire incident types reported to NFIRS in Carrollton, TX
- 1,89640.5%Structure Fires
- 1,67635.8%Outside Fires
- 86818.5%Mobile Property/Vehicle Fires
- 2445.2%Other
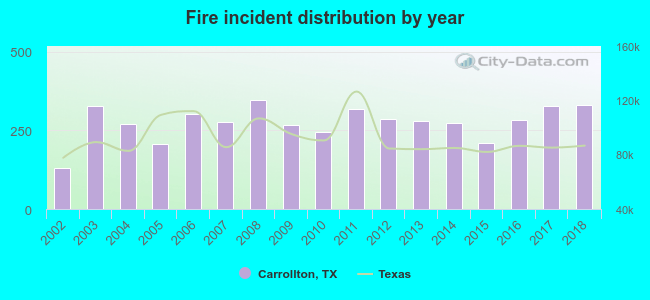 According to the data from the years 2002 - 2018 the average number of fire incidents per year is 276. The highest number of fires - 346 took place in 2008, and the least - 129 in 2002. The data has a rising trend.
The average number of yearly fire incidents per 10k residents in Carrollton, TX compared to nearest cities:
(Note: Based on data for the last 3 years, including only cities with population 5,000 and above)
| Carrollton: | 24.4 |
| Addison: | 50.9 |
| Farmers Branch: | 29.3 |
| Coppell: | 20.3 |
| The Colony: | 16.8 |
| Lewisville: | 27.2 |
| Colony: | 0.2 |
| Plano: | 14.4 |
| Richardson: | 18.0 |
 The median response time based on all reported fire incidents is 5 minutes. This is lower than the state median value.
The median response time in Carrollton, TX compared to nearest cities:
(Note: Based on data for all years, including only cities with at least 500 fire incidents)
| Carrollton: | 5 minutes |
| Addison: | 5 minutes |
| Farmers Branch: | 5 minutes |
| Coppell: | 5 minutes |
| The Colony: | 5 minutes |
| Lewisville: | 5 minutes |
| Plano: | 5 minutes |
| Richardson: | 5 minutes |
| Irving: | 5 minutes |
 According to the reports from the years 2002 - 2018 the average number of fire-related fatalities per year is 0. The highest number of deaths - 2 took place in 2004, and the lowest - 0 in 2003. The data has a dropping trend.
The average number of fatalities per 1,000 fire incidents is 2. This indicator was the highest - 8 in 2002, and the lowest 0 in 2003. The trend for deaths per 1,000 fires is declining. Compared to the state value the number of deaths per 1,000 incidents is about the same.
According to the reports from the years 2002 - 2018 the average number of fire-related fatalities per year is 0. The highest number of deaths - 2 took place in 2004, and the lowest - 0 in 2003. The data has a dropping trend.
The average number of fatalities per 1,000 fire incidents is 2. This indicator was the highest - 8 in 2002, and the lowest 0 in 2003. The trend for deaths per 1,000 fires is declining. Compared to the state value the number of deaths per 1,000 incidents is about the same.Deaths per 1,000 incidents in Carrollton, TX compared to nearest cities:
(Note: Based on data for all years, including only cities with at least 2,500 fire incidents)
| Carrollton: | 1.7 |
| Lewisville: | 2.2 |
| Plano: | 3.0 |
| Richardson: | 1.5 |
| Irving: | 0.7 |
| Frisco: | 1.3 |
| Grapevine: | 0.6 |
| Dallas: | 1.5 |
| Euless: | 1.3 |
 According to the reports from the years 2002 - 2018 the average number of fire-related casualties per year is 4. The highest number of reported injuries - 10 took place in 2008, and the lowest - 0 in 2017. The data has a declining trend.
The average number of casualties per 1,000 fire incidents is 16. This indicator was the highest - 47 in 2002, and the lowest 0 in 2017. The trend for injuries per 1,000 fire incidents is decreasing. Compared to the Texas value the number of injuries per 1,000 fires is higher.
According to the reports from the years 2002 - 2018 the average number of fire-related casualties per year is 4. The highest number of reported injuries - 10 took place in 2008, and the lowest - 0 in 2017. The data has a declining trend.
The average number of casualties per 1,000 fire incidents is 16. This indicator was the highest - 47 in 2002, and the lowest 0 in 2017. The trend for injuries per 1,000 fire incidents is decreasing. Compared to the Texas value the number of injuries per 1,000 fires is higher.Casualties per 1,000 incidents in Carrollton, TX compared to nearest cities:
(Note: Based on data for all years, including only cities with at least 500 fire incidents)
| Carrollton: | 14.1 |
| Addison: | 4.6 |
| Farmers Branch: | 14.7 |
| Coppell: | 8.6 |
| The Colony: | 7.1 |
| Lewisville: | 8.1 |
| Plano: | 11.1 |
| Richardson: | 24.9 |
| Irving: | 7.0 |
 29.7% incidents where reported in the morning and 70.3% in the evening. The most fires (15.0%) took place on Saturday, and the least (13.8%) on Wednesday.
 According to the 4,684 fire incidents from years 2002 - 2018 most fires (10.4%) took place during January, and the least (6.9%) in November.
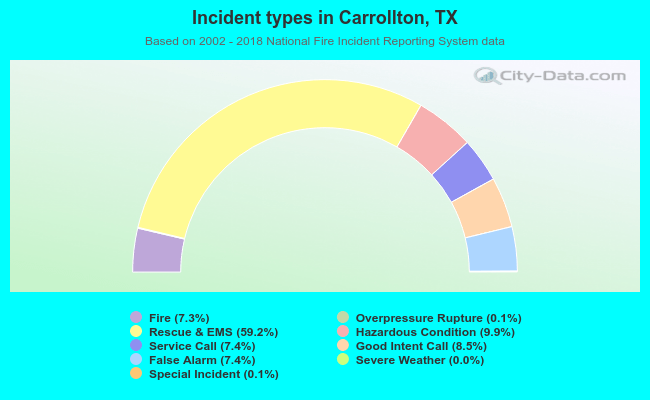 Out of all 63,773 cases reported during the years 2002 - 2018, the most belonged to the categories: Rescue & EMS (59.2%), Hazardous Condition (9.9%), and Good Intent Call (8.5%).
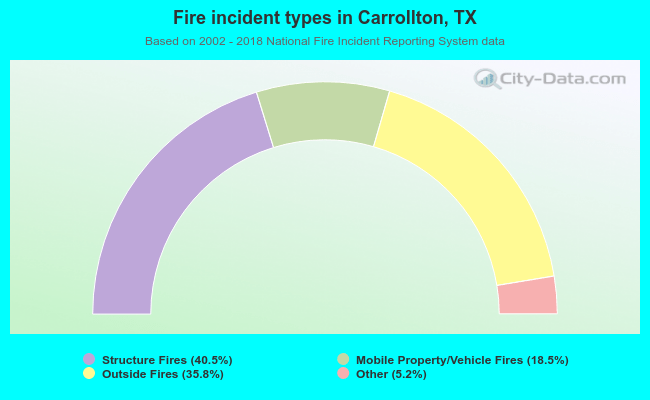 When looking into fire subcategories, the most reports belonged to: Structure Fires (40.5%), and Outside Fires (35.8%).