Lancaster: Fire Incidents, Texas (TX)
Where are fire incidents reported in Lancaster, TX
Something went wrong! Please refresh the page.
| Fire incidents reported | |
|---|---|
| Sreet name | Count |
| PLEASANT RUN RD | 284 |
| HOUSTON SCHOOL RD | 242 |
| DALLAS AVE | 172 |
| BLUEGROVE RD | 160 |
| ROLLING HILLS PL | 146 |
| INTERSTATE 35E HWY | 134 |
| RIVER BEND DR | 104 |
| MAIN ST | 78 |
| WINTERGREEN RD | 72 |
| OAKBLUFF DR | 64 |
| BELT LINE RD | 62 |
| REINDEER RD | 62 |
| BECKLEY ST | 60 |
| BEAR CREEK RD | 40 |
| INTERSTATE 35E SR | 40 |
| LANCASTER HUTCHINS RD | 40 |
| FERRIS RD | 38 |
| CHAPMAN DR | 36 |
| PEPPERIDGE DR | 36 |
| WESTRIDGE AVE | 34 |
| NOKOMIS RD | 32 |
| PLEASANT RUN | 30 |
| COLGATE DR | 26 |
| DANIELDALE RD | 26 |
| GREENE RD | 26 |
| DEWBERRY BLVD | 24 |
| DONLEE RD | 24 |
| EDWARDS ST | 24 |
| I 35 HWY | 24 |
| LONGHORN DR | 24 |
| Other | 422 |
2002 - 2018 National Fire Incident Reporting System (NFIRS) incidents
- Incident types reported to NFIRS in Lancaster, TX
- 21,00362.5%Rescue & EMS
- 3,75911.2%Service Call
- 2,5867.7%Fire
- 2,0706.2%Good Intent Call
- 2,0576.1%False Alarm
- 2,0456.1%Hazardous Condition
- 570.2%Overpressure Rupture
- Fire incident types reported to NFIRS in Lancaster, TX
- 1,04640.4%Structure Fires
- 94336.5%Outside Fires
- 49819.3%Mobile Property/Vehicle Fires
- 993.8%Other
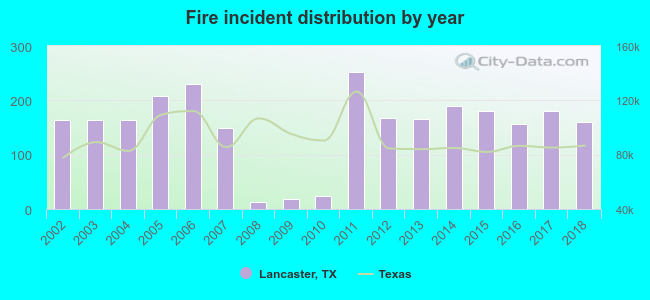 Based on the data from the years 2002 - 2018 the average number of fire incidents per year is 152. The highest number of reported fires - 252 took place in 2011, and the least - 12 in 2008. The data has a dropping trend.
The average number of yearly fire incidents per 10k residents in Lancaster, TX compared to nearest cities:
(Note: Based on data for the last 3 years, including only cities with population 5,000 and above)
| Lancaster: | 43.2 |
| Hutchins: | 76.1 |
| DeSoto: | 30.4 |
| Red Oak: | 70.4 |
| Glenn Heights: | 40.3 |
| Duncanville: | 46.6 |
| Cedar Hill: | 34.2 |
| Balch Springs: | 39.0 |
| Seagoville: | 51.3 |
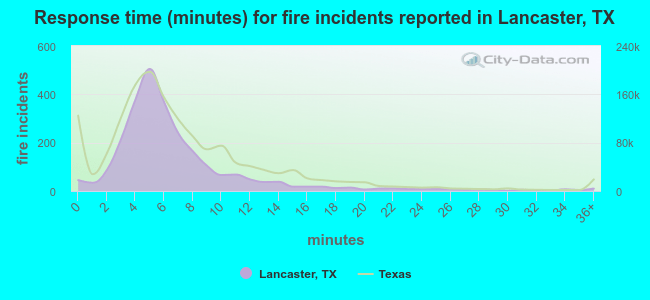 The median response time based on all reported fire incidents is 6 minutes. This is similar to the state median value.
The median response time in Lancaster, TX compared to nearest cities:
(Note: Based on data for all years, including only cities with at least 500 fire incidents)
| Lancaster: | 6 minutes |
| Hutchins: | 6 minutes |
| DeSoto: | 6 minutes |
| Wilmer: | 6 minutes |
| Red Oak: | 6 minutes |
| Glenn Heights: | 5 minutes |
| Ferris: | 10 minutes |
| Duncanville: | 6 minutes |
| Cedar Hill: | 6 minutes |
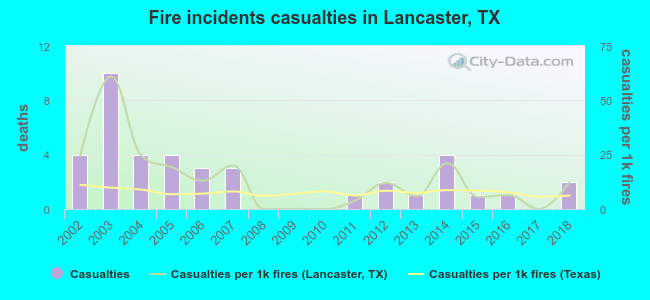 According to the reports from the years 2002 - 2018 the average number of fire-related casualties per year is 2. The highest number of injuries - 10 took place in 2003, and the lowest - 0 in 2008. The data has a declining trend.
The average number of casualties per 1,000 fire incidents is 14. This indicator was the highest - 61 in 2003, and the lowest 0 in 2008. The trend for casualties per 1,000 fire incidents is dropping. Compared to the Texas value the number of casualties per 1,000 incidents is much higher.
According to the reports from the years 2002 - 2018 the average number of fire-related casualties per year is 2. The highest number of injuries - 10 took place in 2003, and the lowest - 0 in 2008. The data has a declining trend.
The average number of casualties per 1,000 fire incidents is 14. This indicator was the highest - 61 in 2003, and the lowest 0 in 2008. The trend for casualties per 1,000 fire incidents is dropping. Compared to the Texas value the number of casualties per 1,000 incidents is much higher.Casualties per 1,000 incidents in Lancaster, TX compared to nearest cities:
(Note: Based on data for all years, including only cities with at least 500 fire incidents)
| Lancaster: | 15.5 |
| Hutchins: | 9.0 |
| DeSoto: | 15.3 |
| Wilmer: | 2.1 |
| Red Oak: | 5.3 |
| Glenn Heights: | 13.0 |
| Ferris: | 8.9 |
| Duncanville: | 9.0 |
| Cedar Hill: | 13.7 |
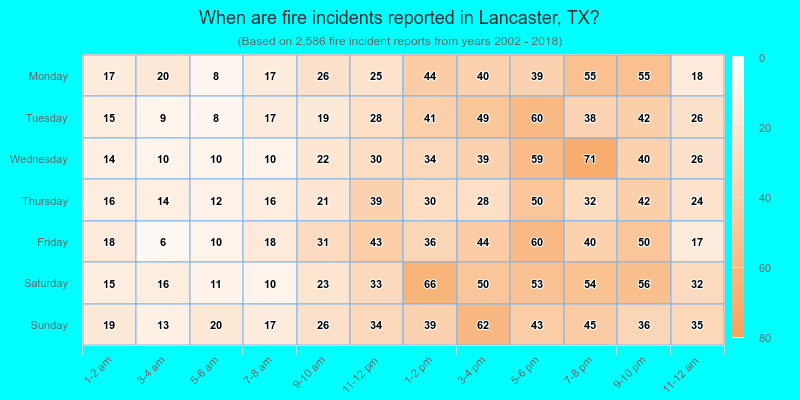
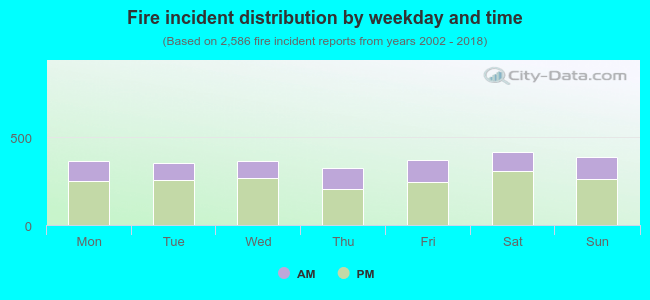 30.4% incidents where reported in the morning and 69.6% in the evening. The most fires (16.2%) took place on Saturday, and the least (12.5%) on Thursday.
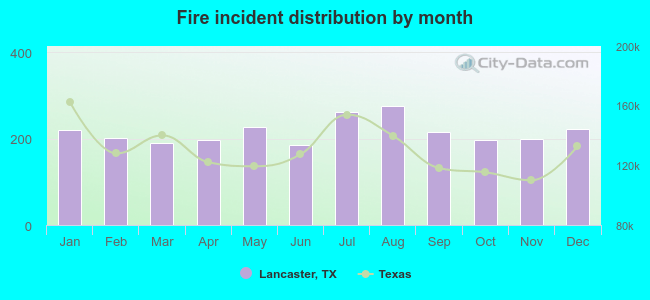 According to the 2,586 reports from years 2002 - 2018 most fires (10.7%) took place during August, and the least (7.2%) in June.
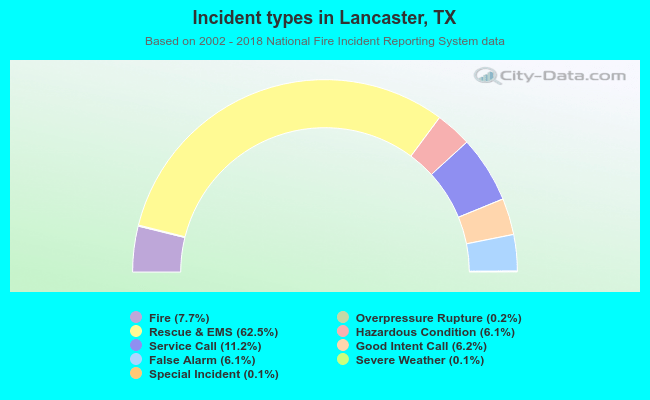 Out of all 33,617 cases reported during the years 2002 - 2018, the most belonged to the categories: Rescue & EMS (62.5%), Service Call (11.2%), and Fire (7.7%).
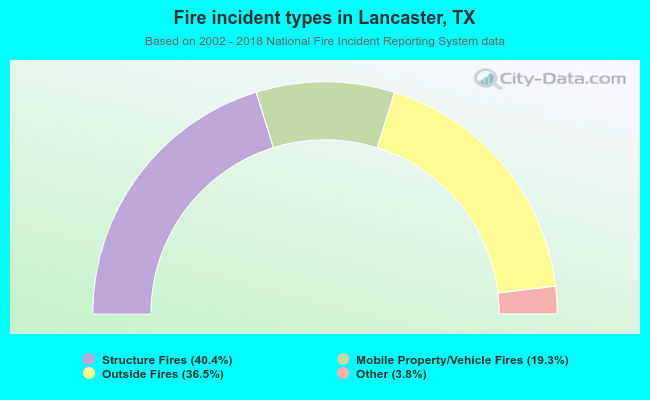 When looking into fire subcategories, the most incidents belonged to: Structure Fires (40.4%), and Outside Fires (36.5%).