Cedar Hill: Fire Incidents, Texas (TX)
Where are fire incidents reported in Cedar Hill, TX
Something went wrong! Please refresh the page.
| Fire incidents reported | |
|---|---|
| Sreet name | Count |
| FM 1382 | 292 |
| HWY 67 | 256 |
| JOE WILSON RD | 178 |
| 67 SR HWY | 154 |
| CLARK RD | 138 |
| PLEASANT RUN RD | 126 |
| BELT LINE RD | 124 |
| HWY 67 SR | 68 |
| UPTOWN BLVD | 68 |
| CEDAR HILL RD | 64 |
| JOE WILSON RD. | 64 |
| WEAVER ST | 60 |
| BELT LINE RD. | 58 |
| CLARK RD. | 46 |
| HIGH POINTE LN | 44 |
| TAR RD | 34 |
| 67 HWY | 32 |
| WATERFORD OAKS DR | 32 |
| DUNCANVILLE RD | 30 |
| LITTLE CREEK RD | 30 |
| LONGHORN BLVD | 30 |
| STRAUS RD. | 28 |
| YORKSHIRE DR | 28 |
| JUSTICE DR | 26 |
| PARKERVILLE RD | 26 |
| STRAUS RD | 26 |
| BEAR CREEK RD | 24 |
| CHAPMAN ST | 24 |
| GLACIER LN | 24 |
| RAINIER ST | 24 |
| Other | 912 |
2003 - 2018 National Fire Incident Reporting System (NFIRS) incidents
- Incident types reported to NFIRS in Cedar Hill, TX
- 17,27557.4%Rescue & EMS
- 3,07010.2%Fire
- 2,9259.7%Good Intent Call
- 2,8939.6%Hazardous Condition
- 2,3767.9%Service Call
- 1,4664.9%False Alarm
- 440.1%Overpressure Rupture
- Fire incident types reported to NFIRS in Cedar Hill, TX
- 1,41746.2%Structure Fires
- 1,04734.1%Outside Fires
- 46515.1%Mobile Property/Vehicle Fires
- 1414.6%Other
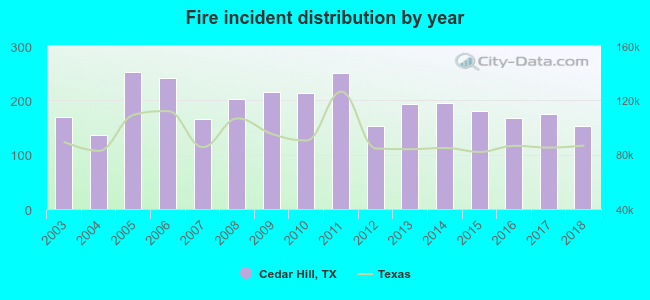 Based on the data from the years 2003 - 2018 the average number of fires per year is 192. The highest number of fires - 253 took place in 2005, and the least - 137 in 2004. The data has a decreasing trend.
The average number of yearly fire incidents per 10k residents in Cedar Hill, TX compared to nearest cities:
(Note: Based on data for the last 3 years, including only cities with population 5,000 and above)
| Cedar Hill: | 34.2 |
| Duncanville: | 46.6 |
| DeSoto: | 30.4 |
| Glenn Heights: | 40.3 |
| Midlothian: | 68.0 |
| Red Oak: | 70.4 |
| Grand Prairie: | 27.7 |
| Lancaster: | 43.2 |
| Mansfield: | 22.7 |
 The median response time based on all reported fire incidents is 6 minutes. This is similar to the state median value.
The median response time in Cedar Hill, TX compared to nearest cities:
(Note: Based on data for all years, including only cities with at least 500 fire incidents)
| Cedar Hill: | 6 minutes |
| Duncanville: | 6 minutes |
| DeSoto: | 6 minutes |
| Glenn Heights: | 5 minutes |
| Midlothian: | 8 minutes |
| Red Oak: | 6 minutes |
| Grand Prairie: | 7 minutes |
| Lancaster: | 6 minutes |
| Mansfield: | 6 minutes |
 Based on the reports from the years 2003 - 2018 the average number of fire-related yearly casualties is 3. The highest number of injuries - 9 took place in 2006, and the lowest - 0 in 2011. The data has a decreasing trend.
The average number of injuries per 1,000 fires is 13. This indicator was the highest - 37 in 2006, and the lowest 0 in 2011. The trend for injuries per 1,000 incidents is dropping. Compared to the Texas value the number of casualties per 1,000 incidents is higher.
Based on the reports from the years 2003 - 2018 the average number of fire-related yearly casualties is 3. The highest number of injuries - 9 took place in 2006, and the lowest - 0 in 2011. The data has a decreasing trend.
The average number of injuries per 1,000 fires is 13. This indicator was the highest - 37 in 2006, and the lowest 0 in 2011. The trend for injuries per 1,000 incidents is dropping. Compared to the Texas value the number of casualties per 1,000 incidents is higher.Casualties per 1,000 incidents in Cedar Hill, TX compared to nearest cities:
(Note: Based on data for all years, including only cities with at least 500 fire incidents)
| Cedar Hill: | 13.7 |
| Duncanville: | 9.0 |
| DeSoto: | 15.3 |
| Glenn Heights: | 13.0 |
| Midlothian: | 12.3 |
| Red Oak: | 5.3 |
| Grand Prairie: | 20.4 |
| Lancaster: | 15.5 |
| Mansfield: | 18.9 |
 29.2% incidents where reported in the morning and 70.8% in the evening. The most fires (16.5%) took place on Saturday, and the least (12.6%) on Thursday.
 According to the 3,070 fire incidents from years 2003 - 2018 most fires (10.5%) took place during January, and the least (6.6%) in October.
 Out of all 30,074 cases reported during the years 2003 - 2018, the most belonged to the categories: Rescue & EMS (57.4%), Fire (10.2%), and Good Intent Call (9.7%).
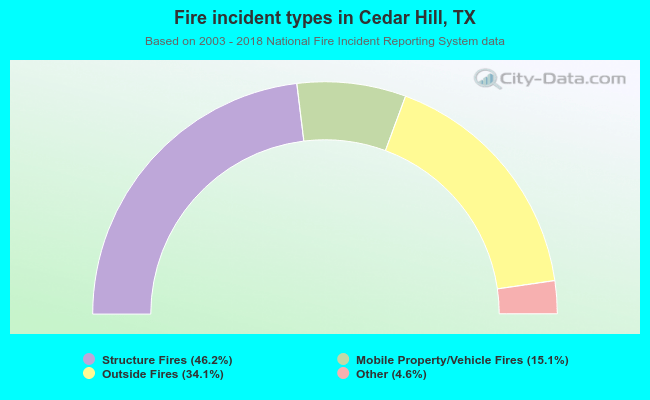 When looking into fire subcategories, the most incidents belonged to: Structure Fires (46.2%), and Outside Fires (34.1%).