Cleburne: Fire Incidents, Texas (TX)
Where are fire incidents reported in Cleburne, TX
Something went wrong! Please refresh the page.
| Fire incidents reported | |
|---|---|
| Sreet name | Count |
| MAIN ST | 400 |
| HENDERSON ST | 394 |
| FM 4 | 182 |
| NOLAN RIVER RD | 112 |
| FM 2135 RD | 94 |
| WILHITE ST | 92 |
| HWY 171 RD | 88 |
| FM 1434 FM | 82 |
| ANGLIN ST | 80 |
| HWY 67W HWY | 78 |
| KILPATRICK AVE | 78 |
| PIPELINE RD | 78 |
| BRAZOS AVE | 68 |
| INDUSTRIAL BLVD | 66 |
| WOODARD AVE | 64 |
| COUNTRY CLUB RD | 62 |
| CR 312 | 62 |
| ROBINSON ST | 62 |
| CHAMBERS ST | 56 |
| CR 310 | 56 |
| FM 2415 RD | 54 |
| PHILLIPS ST | 54 |
| FM 2135 | 52 |
| GRANBURY ST | 52 |
| WILLIAMS AVE | 52 |
| FM 3136 RD | 50 |
| FM 1434 | 44 |
| CHASE AVE | 40 |
| CR 314 RD | 40 |
| HYDE PARK BLVD | 40 |
| Other | 2,017 |
2002 - 2018 National Fire Incident Reporting System (NFIRS) incidents
- Incident types reported to NFIRS in Cleburne, TX
- 22,76858.1%Rescue & EMS
- 4,74912.1%Fire
- 3,5499.1%Hazardous Condition
- 3,3668.6%Service Call
- 3,2348.3%Good Intent Call
- 1,4373.7%False Alarm
- 470.1%Special Incident
- Fire incident types reported to NFIRS in Cleburne, TX
- 2,61855.1%Outside Fires
- 1,30427.5%Structure Fires
- 56311.9%Mobile Property/Vehicle Fires
- 2645.6%Other
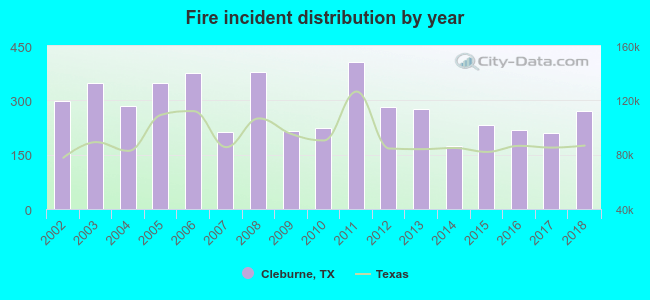 According to the data from the years 2002 - 2018 the average number of fires per year is 279. The highest number of reported fire incidents - 406 took place in 2011, and the least - 175 in 2014. The data has a decreasing trend.
The average number of yearly fire incidents per 10k residents in Cleburne, TX compared to nearest cities:
(Note: Based on data for the last 3 years, including only cities with population 5,000 and above)
| Cleburne: | 78.2 |
| Keene: | 99.7 |
| Joshua: | 141.1 |
| Burleson: | 41.9 |
| Crowley: | 48.7 |
| Rendon: | 22.8 |
| Everman: | 45.4 |
| Mansfield: | 22.7 |
| Forest Hill: | 53.9 |
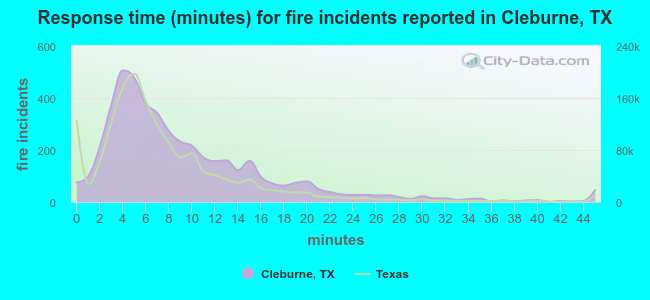 The median response time based on all reported fire incidents is 7 minutes. This is close to the state median value.
The median response time in Cleburne, TX compared to nearest cities:
(Note: Based on data for all years, including only cities with at least 500 fire incidents)
| Cleburne: | 7 minutes |
| Keene: | 9 minutes |
| Joshua: | 11 minutes |
| Rio Vista: | 15 minutes |
| Godley: | 13 minutes |
| Alvarado: | 10 minutes |
| Burleson: | 8 minutes |
| Grandview: | 10 minutes |
| Crowley: | 6 minutes |
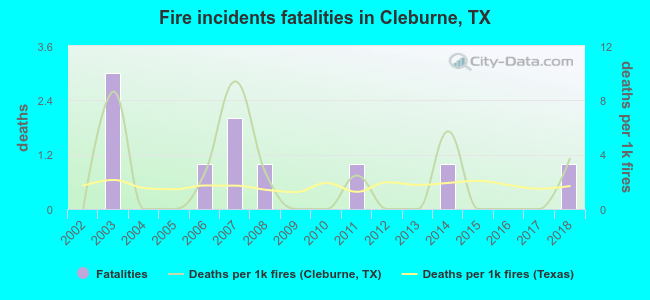 Based on the reports from the years 2002 - 2018 the average number of fire-related fatalities per year is 1. The highest number of deaths - 3 took place in 2003, and the lowest - 0 in 2002. The data has an increasing trend.
The average number of fatalities per 1,000 fires is 2. This indicator was the highest - 9 in 2007, and the lowest 0 in 2002. The trend for fatalities per 1,000 incidents is growing. Compared to the state value the number of fatalities per 1,000 fires is higher.
Based on the reports from the years 2002 - 2018 the average number of fire-related fatalities per year is 1. The highest number of deaths - 3 took place in 2003, and the lowest - 0 in 2002. The data has an increasing trend.
The average number of fatalities per 1,000 fires is 2. This indicator was the highest - 9 in 2007, and the lowest 0 in 2002. The trend for fatalities per 1,000 incidents is growing. Compared to the state value the number of fatalities per 1,000 fires is higher.Deaths per 1,000 incidents in Cleburne, TX compared to nearest cities:
(Note: Based on data for all years, including only cities with at least 2,500 fire incidents)
| Cleburne: | 2.1 |
| Alvarado: | 0.8 |
| Burleson: | 0.8 |
| Mansfield: | 0.7 |
| Granbury: | 0.0 |
| Midlothian: | 1.5 |
| Fort Worth: | 1.9 |
| Arlington: | 1.9 |
| Cedar Hill: | 1.3 |
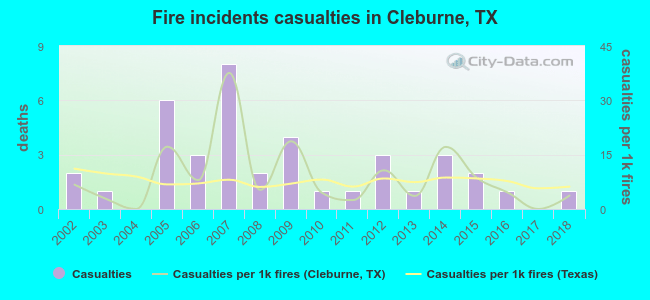 Based on the data from the years 2002 - 2018 the average number of fire-related yearly casualties is 2. The highest number of reported injuries - 8 took place in 2007, and the lowest - 0 in 2004. The data has a declining trend.
The average number of casualties per 1,000 fire incidents is 9. This indicator was the highest - 38 in 2007, and the lowest 0 in 2004. The trend for injuries per 1,000 fire incidents is declining. Compared to the Texas value the number of casualties per 1,000 fires is about the same.
Based on the data from the years 2002 - 2018 the average number of fire-related yearly casualties is 2. The highest number of reported injuries - 8 took place in 2007, and the lowest - 0 in 2004. The data has a declining trend.
The average number of casualties per 1,000 fire incidents is 9. This indicator was the highest - 38 in 2007, and the lowest 0 in 2004. The trend for injuries per 1,000 fire incidents is declining. Compared to the Texas value the number of casualties per 1,000 fires is about the same.
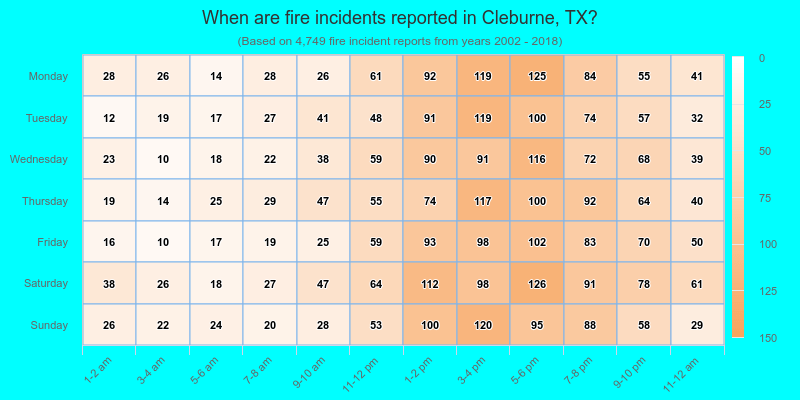
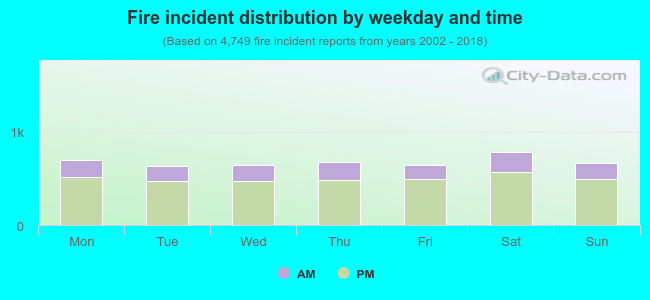 26.2% incidents where reported in the morning and 73.8% in the evening. The most fires (16.6%) took place on Saturday, and the least (13.4%) on Tuesday.
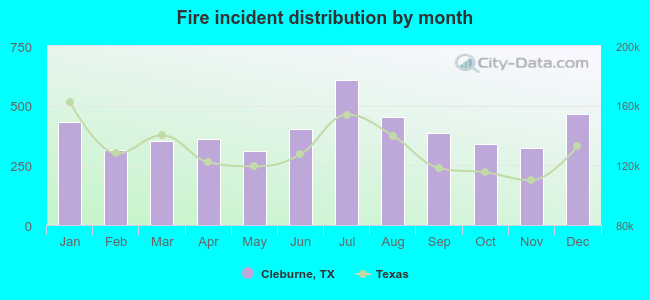 Based on the 4,749 incident reports from years 2002 - 2018 most fires (12.8%) took place during July, and the least (6.5%) in May.
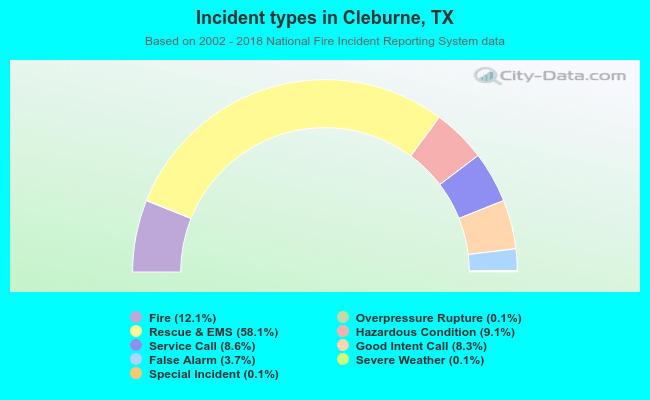 Out of all 39,194 cases reported during the years 2002 - 2018, the most belonged to the categories: Rescue & EMS (58.1%), Fire (12.1%), and Hazardous Condition (9.1%).
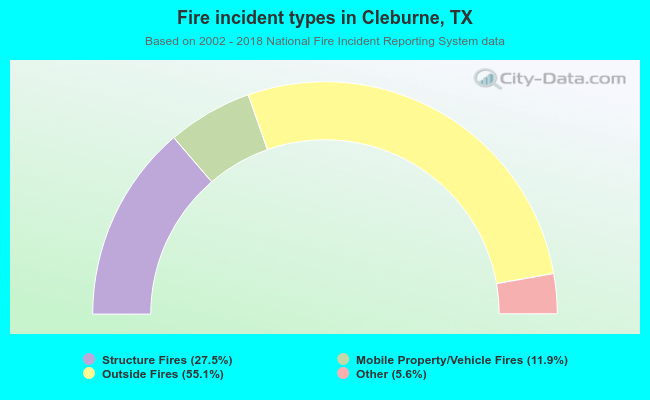 When looking into fire subcategories, the most reports belonged to: Outside Fires (55.1%), and Structure Fires (27.5%).